view_agenda
Questions
Find the perfect question by filtering through every previous QCAA Mathematical Methods external exam question
notifications
Question Classifications
We’re conducting a final review of the classifications and formatting for our recently onboarded questions. If you have any feedback, please share it with us here.
QUESTION 1 The graphs of f(x) = ¢* and g(x) =x~— 1 are shown. The area of the shaded section bounded by these graphs between the linesx=0and x =1 is A) 1-e (B) e-2 5 ©) B 1 (D) e=3
QUESTION 2 X i e +1 Determine I e (A) (B) ©) (D) x—e “+c x+te¥+c l+xe*+c x+xe*+c
QUESTION 3 Determine 2 j (4x+ 6)3 dx (A) 16(4x+6)* +¢ (B) 8(4x+6)*+c (4x +6)* 2 (4x + 6)* 8 ©) +C T~ (D)
QUESTION 4 Pulse rates of adult men are approximately normally distributed with a mean of 70 and a standard deviation of 8. Which of the following choices correctly describes how to determine the proportion of men that have a pulse rate greater than 787 (A) Determine the area to the left of z= 1 under the standard normal curve. (B) Determine the area to the right of z = 1 under the standard normal curve. (C) Determine the area to the right of z = —1 under the standard normal curve. (D) Determine the area between z =—1 and z = 1 under the standard normal curve.
QUESTION 5 The equation of the tangent to the curve f(t) =te` att=11is (A) y=et (B) y=2et—e ©) y=et—e® +1 (D) y=2et—2¢*+1
QUESTION 6 If the probability of success in a Bernoulli trial is 0.30 the variance is A) 0.70 (B) 0.46 (C) 0.30 (D) 0.21
QUESTION 7 The life expectancy (in years) of an electronic component can be represented by the probability density function 1 p(x) =142 0 otherwise > 1 The probability that the component lasts between 1 and 10 years is (A) 0.010 (B) 0.100 (C) 0.900 (D) 0.990
QUESTION 8 A test includes six multiple choice questions. Each question has four options for the answer. If the answers are guessed the probability of getting at most two questions correct is represented by 6 0 6 6 1 5 (A) 5 0.25 x 0.75° + 1 0.25 x 0.75 6 0 6 [0 1 s (6 2 4 (B) N 0.25 x 0.75° + 1 0.25 x 0.75° + 5 0.25“x 0.75 ©) 1 6 0.25% % 0.75° + (Jo.zsl x 0.755] @ oo 6 6 0.25% % 0.75° + (Jo.zsl x 0.75° + [2]0.252 x 0.754J
QUESTION 9 Determine I X—H dx x2 +2x (A) ln[2x+2j+c (B) In(2x+2)+c (C) %ln(xz +2x)+¢ (D) 2In(x? +2x)+c
QUESTION 10 Two types of material (A and B) are being tested for their ability to withstand different temperatures. A random selection of both materials was subjected to extreme temperature changes and then classified according to their condition after they were removed from the testing facility. The results are shown in the table. Material Broke completely Showed defects ot | 5 | 3| o T s s An approximate 95% confidence interval for the probability that material A will break completely or show defects is given by [c—l.% /w cfl.% /Mj n n The values of ¢ and » are @A) 9 andos 95 ®) Y andos 200 ©) 140 and9s 200 @) 9% and 200 200
QUESTION 11 (3 marks) Determine the derivative of each of the following with respect to x. 1 D 7 b) y=x`xe* Express your answer in factorised form. [1 mark] [2 marks]
QUESTION 12 (5 marks) An object is moving in a straight line from a fixed point. The object is at the origin initially. The acceleration a (in m s ™) of the object is given by a(f) =m cos(mt) t=>0 where ¢ is time in seconds. The velocity at =115 0.5 m s ! a) Determine the initial acceleration. [1 mark] b) Determine the initial velocity. [2 marks] c) Determine the displacement after one second. [2 marks]
QUESTION 13 (7 marks) A function is defined as f(x) = x(In(x))? x > 0. The graph of the function is shown and has a local maximum at point 4 and a global minimum at point B. The derivative of the function is given by f`(x) = 2 In(x) + (In(x))? x > 0. a) Verify that there 1s a stationary point at x = 1. [2 marks] b) Determine the coordinates of A. [3 marks] The graph of the function has a point of inflection at x = ¢` c) Determine p. [2 marks]
QUESTION 14 (3 marks) Determine the area of the triangle shown. C Not drawn to scale
QUESTION 15 (4 marks) Solve the following equations. a) 4e* =100 [1 mark] b) 2log x—log (x-1)=1 [3 marks]
QUESTION 16 (4 marks) Consider the following graph of f(x). Diagram 1 Diagram 2 Diagram 3 Justify your decisions using mathematical reasoning.
QUESTION 17 (6 marks) The volume of water in a tank is represented by a function of the form Vt)= Aekt where V` is in litres and ¢ 1s in minutes. Initially the volume is 100 litres and it is decreasing by 50 litres per minute. : : : : : 50 .. : Determine the time at which the volume is decreasing at the rate of 3 litres per minute. Express your answer in the form In(a).
QUESTION 18 (6 marks) The function f(x) has the form given by f(x) = 3 log2 (x+a)+b The function g(x) has the form given by g(x) =—log (x + ¢) + 5 A section of the graphs of the two functions is shown. X / a oo r Determine the values of a b and c.
QUESTION 19 (6 marks) A horizontal point of inflection is a point of inflection that is also a stationary point. In(x) kx Determine the value/s of £ for which the graph of f(x) = r xrl has only one horizontal point X+ of inflection.
QUESTION 20 (6 marks) At the end of the first stage of its growth cycle a species of tree has a height of 5 metres and a trunk radius of 15 cm. In the second stage of its growth cycle the tree stays at this height for the next 10 years. However the growth rate of the trunk radius (in cm per year) varies over the 10 years and is given by the function 1 r(t)=1.5+ sm(?j Assume the density (mass per unit volume) of the tree trunk is approximately 1 g/(:m3 and the tree trunk is in the shape of a cylinder. Determine the ratio of the trunk`s mass at the end of the second stage to its mass at the end of the first stage.
QUESTION 1 The limit of 12 -1 as h approaches 0 is closest to A) 0.0 ! (B) 1.0 C) 2.5 (D) 3.0
QUESTION 2 The pH of a substance is a measure of its acidity and is given by the formula pH = —log; [H ] where [H ]is the concentration of hydrogen ions in moles per litre. If a solution has a pH equal to 0.2 the concentration of hydrogen ions in moles per litre is closest to (A) 0.32 (B) 0.63 (C) 0.70 (D) 1.8
QUESTION 3 Let R be the region enclosed by the graph of y = xe” the x-axis and the lines x =—1 and x = 1. The area of R is closest to A) 0.74 (B) 1.26 C) 2.35 (D) 3.09
QUESTION 4 Consider the function f(x) =log (x+¢g) wherep>1and 0 <g <. Which of the following could be the graph of f(x)? (A) (B) © (D)
QUESTION 5 An object moves in a straight line with a velocity v given by v(t)=40(e ` - g )ms ` where £ >0 The object is at the origin initially. The displacement—time graph in the first 6 seconds is (A) ------ ©)
QUESTION 6 Oil is leaking from a tanker at the rate of »(¢) = 9000¢ % litres per hour where ¢ is in hours. Determine how much oil leaks from the tanker (to the nearest litre) from time # = 0 to time ¢ = 10. (A) 38910 litres (B) 8756 litres (C) 7782 litres (D) 1556 litres
QUESTION 7 The records of a shoe manufacturer show that 10% of shoes made are defective. Assuming independence the probability of getting 2 defective shoes in a batch of 20 is A) 0.1937 (B) 0.2852 (C) 0.3917 (D) 0.6083
QUESTION 8 Determine the size of angle 4 in the triangle. C 9.9 8.8 A 11.3 B Not drawn to scale (A) 48.5° (B) 614° (C) 118.6° (D) 131.5°
QUESTION 9 The displacement of a particle (in metres) at time ¢ (in seconds) is represented by the function s@)=tln@t)—t 0<t<4 Determine the approximate acceleration of the particle at time ¢ = 3. (A) 0.66ms > (B) 0.33ms> (C) -033ms™ (D) —0.66m s
QUESTION 10 The approximate value of x where the graph of the function y = X +6x%+Tx— 2 cos(x) changes concavity is (A) -3.26 (B) -2.85 (C) -2.20 (D) —1.89
QUESTION 11 (4 marks) A sugar company samples the packets of sugar it produces and finds that 5% of packets are underweight. Consider a batch of 20 packets. a) Determine how many packets of sugar the company can expect to be underweight in a batch of 20 packets. [1 mark] b) Determine the variance of the batch. [1 mark] c) Determine the probability that at most one of the packets of sugar in the batch is underweight. [2 marks]
QUESTION 12 (7 marks) The rates of change in population for two cities are given by 45 City A: A`() = — y ® t+1 City B: B`(¢) = 105¢ %% where ¢ is the number of years since 2018 and both 4`(f) and B`(f) are measured in people per year. At the beginning of 2018 City A had a population of 5000 and City B had a population of 3500. a) Determine the population models for both cities. [3 marks] b) Use the information in 12a) to predict the population of City B at the beginning of 2028. /I mark] c) Use the information in 12a) to predict the year in which the population of both cities will be the same. [3 marks]
QUESTION 13 (6 marks) An online retailer claims that 90% of all orders are shipped within 12 hours of being received. On a particular day 121 orders were received and 102 orders were shipped within 12 hours. a) State the sample proportion of orders shipped within 12 hours. [1 mark] The distribution of the sample proportion of all orders that are shipped within 12 hours of being received on any day is approximately normal. b) Assuming the online retailer`s claim is true find the probability that in a random sample of 121 less than 85% of all orders are shipped within 12 hours. [3 marks] c) Use the result from 13b) to evaluate the reasonableness of the online retailer`s claim. [2 marks]
QUESTION 14 (6 marks) Let X denote the time in minutes between the arrival of trains at a station. The cumulative distribution function of X is defined by —— 5<x<10 F(x)= X 0 otherwise a) Determine the probability density function of X. [3 marks] b) Determine the probability that 5 < X <7. [1 mark] c¢) Determine the mean time between the arrival of trains at the station. [2 marks]
QUESTION 15 (3 marks) A field is divided into five sections as shown. The width of each section is 1 metre. The perpendicular height in metres of each section is given in the diagram. The area of the field was approximated using the trapezoidal rule and found to be 11.12 m` Not drawn to scale a) Determine the height marked x on the diagram. [2 marks] b) Determine the area of the field given the shape of the field is modelled by the function X L 0<x<5 x? +1 [1 mark] J(x)=
QUESTION 16 (4 marks) Bottles of soft drink should contain a volume with a mean of 591 mL but some variation is expected. Any bottle at or below the 20th percentile of the volume distribution is rejected. A percentile is a measure in statistics that shows the values below which a given percentage of observations occur. Thirty-five per cent of the bottles contain 593 mL or more of soft drink. Assuming the volumes are normally distributed determine the smallest volume (in mL) that will be accepted.
QUESTION 17 (4 marks) In a survey of 326 lecturers 303 said that on at least one occasion a mobile phone had rung in a lecture they were giving. Determine the sample size required to conduct a follow-up survey that provides 95% confidence that this one-point estimate is correct to within + 0.02 of the population proportion.
QUESTION 18 (4 marks) The diagram shows the quadrilateral ABCD. B 4.1 cm 7.6 cm Not drawn to scale D Determine the perimeter of the quadrilateral.
QUESTION 19 (7 marks) Consider the following information when completing this question. 2 The length of a curve y = f(x) over the interval [a b] = Ib 1+ (%j dx a \f 67 You are driving along a road with a vertical distance above sea level D (in metres) given by the function D) =300 + In(x> -3x + ¢) where x 1s the horizontal distance from an initial point of measurement (in kilometres) at sea level. Assume that if x 1s positive you are east of the initial point of measurement and if x is negative you are west of the 1nitial point of measurement. You start your drive along the road at a horizontal distance of 10 kilometres west of the initial point of measurement and drive until you are at a horizontal distance of 10 kilometres east of the initial point. Determine the time you spend driving downhill if you drive downhill at an average speed of 40 km/h.
QUESTION 20 (5 marks) Assuming the approximate normality of sample proportions (p and p ) and based on two independent samples the approximate confidence interval for the difference of two proportions is given by pd-p) p 1-p ) pd-p) p 0-p )) ————————— P =t i B i iy If the approximate confidence interval for the difference between two proportions does not contain 0 this provides evidence that the two proportions are not equal. The data in the table shows the observed frequencies of two drink preferences for independent samples of people who live in Town A and Town B. Using the approximate 99% confidence interval for the difference of two proportions determine if there is evidence to conclude that drink preference is associated with the town where the person lives.
QUESTION 1 2log;o (x)—log;o(3x) is equal to (A) logm[?] (B) log (x2 - 3x) 2logyg (x) log;(3x) (D) —log;o(x) ©)
QUESTION 2 The table shows the time a technician has spent servicing photocopiers. What is the probability that a given service required at least 10 minutes but less than 20 minutes? (A) 0.15 (B) 0.35 (C) 0.70 (D) 0.85
QUESTION 3 Determine JlOe‘“dx` ] 0643{‘4`] 4x +1 (A) +c (B) 40e* +c (C) %e“-“ +c (D) 2™ +¢
QUESTION 4 The second derivative of the function f(x) is given by f” (x)=— The interval on which the graph of f (x) 1S concave up is A x<0 (B) x<0 ) x>0 (D) x>0
QUESTION 5 The graph of f (x) is shown. -5 Which of the following could be the graph of / (x)? (A) (B) ©) (D)
QUESTION 6 A random variable X 1s the number of successes in a Bernoulli experiment with #z trials each with a probability of success p and a probability of failure g. The probability distribution table of X is shown.
QUESTION 7 Determine J (2x+3)dx | (A) 2 (B) 4 C) 14 (D) 16
QUESTION 8 The continuous random variable X has the probability density function - 1<x< -~ —_— = S Il = 2 b | W 0 otherwise The mean of X 1s (A) ln(%) it ©) h{%) (D) 1
QUESTION 9 A basket contains 10 green apples and 30 red apples. Three apples are drawn at random from the basket with replacement. Determine the probability that exactly two of the three apples are green. 3 (A) o 9 (B) o 10 ©) o (D) 27 64
QUESTION 10 Handspans of teenagers are approximately normally distributed with a mean of 15 cm and a standard deviation of 2 cm. Which of the following groups is expected to be the largest? (A) teenagers with handspans that are between 7 cm and 11 cm (B) teenagers with handspans that are between 11 cm and 15 cm (C) teenagers with handspans that are between 13 cm and 17 cm (D) teenagers with handspans that are between 17 cm and 21 cm
QUESTION 11 (5 marks) Determine the derivative with respect to x of the following functions. a) y= (e“` + l)3 b y= &g\) (Give your answer in simplest form.) X [2 marks] [3 marks]
QUESTION 12 (5 marks) Solve for x in the following. a) log (5x+7)f 5 [2 marks] b) loglu(x‘i‘3)+]0g]0(x_3): logm(gx—29) [3 marks]
QUESTION 13 (5 marks) Consider the functions f(x)=x”and g(x)= 4x. a) Determine the x-coordinates of the points of intersection of the graphs of the two functions. [2 marks] b) Use the results from Question 13a) to calculate the area enclosed by the graphs of f(‘c‘) and g(‘c) [3 marks]
QUESTION 14 (4 marks) Consider the function f(x)=In(3x+4) for x > _?4 a) Determine f`(x). [1 mark] b) Determine the x-intercept of the graph of f/(x). [2 marks] c) Determine the gradient of the tangent to the graph of f(x) at the x-intercept. [1 mark]
QUESTION 15 (4 marks) In the isosceles triangle ABC angle C is 120° and side a is 4 cm. a) Draw the triangle indicating all given information. [1 mark] b) Calculate the area of the triangle in cm?. (Give your answer in simplest form.) [3 marks]
QUESTION 16 (4 marks) A tangent is drawn at the point (1 e) on the graph of the function y = ¢` as shown. Not to scale Determine the area of the shaded triangle.
QUESTION 17 (3 marks) In any five-day working week Leonardo either catches a bus to work or uses another form of transportation. On average he catches the bus to work on three of the five days. His decision on any given day is independent of his decision on any other day. Determine the probability that Leonardo catches a bus to work on exactly one day in a given five-day working week.
QUESTION 18 (4 marks) The graph of y = f(x) where f(x) is the quadratic function f(x)= ax” + bx +4 is shown. Two regions of the area between the graph of y = /(x) and the x-axis are shaded. Not to scale : .2 43 . 5 Region P has an area of %umts“ and Region Q has an area of ?) units”. Determine the values of a and b.
QUESTION 19 (4 marks) A firm aims to have 95% confidence in estimating the proportion of office workers who respond to an email in less than an hour to within + 0.05. A survey has never been undertaken before so no past data is available. The firm believes that if the proportion is 0.5 then this will result in the largest variability in the sample proportion. Based on this determine the sample size needed using the approximate value of z = 2 for the 95% confidence interval. Justify the choice of 0.5 for the proportion.
QUESTION 20 (7 marks) The population of rabbits (P) on an island in hundreds is given by P(7) = 1In (3t)+6 1> 0 where # is time in years. Determine the intervals of time when the population is increasing and the intervals when it is decreasing.
QUESTION 1 The scores obtained on a test can be assumed to be normally distributed with a mean of 102 and a standard deviation of 19. What proportion of scores are over 113? (A) 0.2813 (B) 0.5789 (C) 0.7187 (D) 0.8216
QUESTION 2 A substance is being heated such that its temperature 7 in °C after # minutes is given by the function 7` = 2 The first integer value of 7 for which the instantaneous rate of change of temperature is greater than 100 °C per minute is (A) t=10 (B) =9 C) t=8 (D) t=7
QUESTION 3 A random sample of people were surveyed about the most important factor when deciding where to shop. The results appear in the table. Quality of merchandise Shopping environment If the sample size was 1200 the approximate 95% confidence interval for the proportion of people who identified price as the most important factor is (A) (0.395 0.405) (B) (0.386 0.414) (C) (0.377 0.423) (D) (0.372 0.428)
QUESTION 4 3 Using the trapezoidal rule with an interval size of 1 the approximate value of the integral J 0.5%dx is 0 A) 1.25 (B) 1.26 C) 131 (D) 1.88
QUESTION 5 Solve for x given that logy(x—1)=2. (A) 7 (B) 8 © 9 (D) 10
QUESTION 6 When seeds of a certain variety of flower are planted the probability of each seed germinating is 0.8. If eight seeds are planted what is the probability that at least six seeds will germinate? A) 0.797 (B) 0.503 (C) 0.294 (D) 0.001
QUESTION 7 : 11 : Determine f(x) given f`(x)= 6x% +—+— and f (1)=5. ~ 27 (A) f(\) =2x + %-4— ln(_r) -1 X B) f(x)=2x - L (x)+4 X ©) f(x) =2 —l+i}+2 X x- “ 3 2 D) f(x)=2x+=+5-2 X X~
QUESTION 8 The displacement (in metres) of a particle is given by s(‘t) =-3cos(7)+2sin (t) where 7 1s in seconds. : : : T : The instantaneous velocity of the particle at time 7 = . seconds is et (A) 3ms! (B) 2ms”! (C) 2ms”! (D) 3ms`
QUESTION 9 The graphs of the functions f(x)=2¢ +5 and g(x)= point A. 3 . : : : — intersect at point A. Determine the coordinates of B A) (1.609 15) (B) (1.099 1) (C) (0.4065 2) (D) (-0.693 6)
QUESTION 10 An object travels in a straight line so that its velocity at time # seconds is given by v(#)=2¢+sin(2¢). Determine the expression for acceleration as a function of time. (A) a(t)=2+2cos(2r) (B) a(t):2—%cos(2f) (©) a(t)=1 +2cos(2¢) (D) a(t)ztz— cos(27) b | —
QUESTION 11 (5 marks) Consider the function f(x)=¢ sin(x) 0<x<27 a) State the exact values of the x-intercepts of the graph of f`(x). [2 marks] b) Write an expression for the area enclosed between the graph of f (r) and the x-axis. [2 marks] ¢) Determine the area enclosed between the graph of f(x) and the x-axis to the nearest square unit. [1 mark]
QUESTION 12 (4 marks) The velocity function of an object in m s is given by v(t) = cos[6r + %] +2 0<1<S. Initially the object is at the origin. a) Determine the displacement function. [2 marks] b) What is the displacement of the object from the origin in metres (m) after three seconds? [2 marks]
QUESTION 13 (7 marks) The amount of gravel (in tonnes) sold by a construction company in a given week is a continuous random variable X and has a probability density function defined by: f`(x)={c(l_x2)* 0<x<l 0 otherwise 3 a) Show that ¢ = 5 b) Determine P(X <0.25). c¢) Determine the variance of X. [1 mark] [2 marks] [4 marks]
QUESTION 14 (7 marks) The heights of students at School A are normally distributed with a mean of 165 cm and a standard deviation of 15 cm. a) Determine the probability that a student chosen at random from School A is shorter than 180 cm. [1 mark] b) Determine the minimum integer value of the height of a student who is in the top 2% of this distribution. [3 marks] The heights of students at School B are also normally distributed. A student at School B has the same height as the height determined in Question 14b) but their corresponding z-score is 3. c) Determine which student`s height ranks higher in terms of percentile for their school. [3 marks]
QUESTION 15 (4 marks) A new internet search engine gives a ranking R to each website based on the function R = log; (5011r2 ) where / is the number of hits (visits) the website has received. If a website currently has 100 hits determine how many more hits they need to increase their ranking by 1.
QUESTION 16 (4 marks) In the diagram DC represents a 60 metre vertical tower. A and B are two points in the same horizontal plane as the foot C of the tower. The angle above the horizontal from A to D is 28° and the angle above the horizontal from B to D is 35°. 35° Not to scale ‘B The bearing of C from A is 050°T and the bearing of C from B is 300°T. Determine the distance between A and B to the nearest metre.
QUESTION 17 (4 marks) Rabbits and foxes are among two species of mammals that live on an isolated island. Rabbits represent a significant food source for the foxes. The populations of rabbits and foxes were monitored each month for two years. The graph shows the population of foxes (in thousands) and the population of rabbits (in thousands) at any time ¢ (in months) over the two years. The two populations can be modelled using trigonometric functions. (0 14.5) (12 14.5) - o NN (15 11) Population (thousands) 0 3 10 15 Time (¢) in months since 1 January 20 Foxes ------- Rabbits Jane believes that there were periods of time over the two years when the total population of foxes and rabbits on the 1sland exceeded 25 000. Evaluate the reasonableness of Jane`s claim.
QUESTION 18 (3 marks) The number of animals in a population (in thousands) is modelled by the function P such that . 100 P(1)= 1+4e Determine the number of animals in the population when the population is growing the fastest. — where 7 18 in years.
QUESTION 19 (4 marks) A random variable X defined over the interval a < x < b is uniformly distributed if its probability density function is defined by: I —— a<x<bh f(x)=1(b=a)` 0 otherwise The expected value and variance of a uniform random variable X are 2 E(X):@ Var(X)= (b;;) A manufacturer has observed that the time that elapses between placing an order with a supplier and the delivery of the order is uniformly distributed between 100 and 180 minutes. Determine the probability that the time between placing an order and delivery of the order will be within one standard deviation of the expected time.
QUESTION 20 (3 marks) The random variable B is normally distributed with a mean of 0 and a standard deviation of 1. Determine the probability that the quadratic equation x? +3x+2B =0 has real roots.
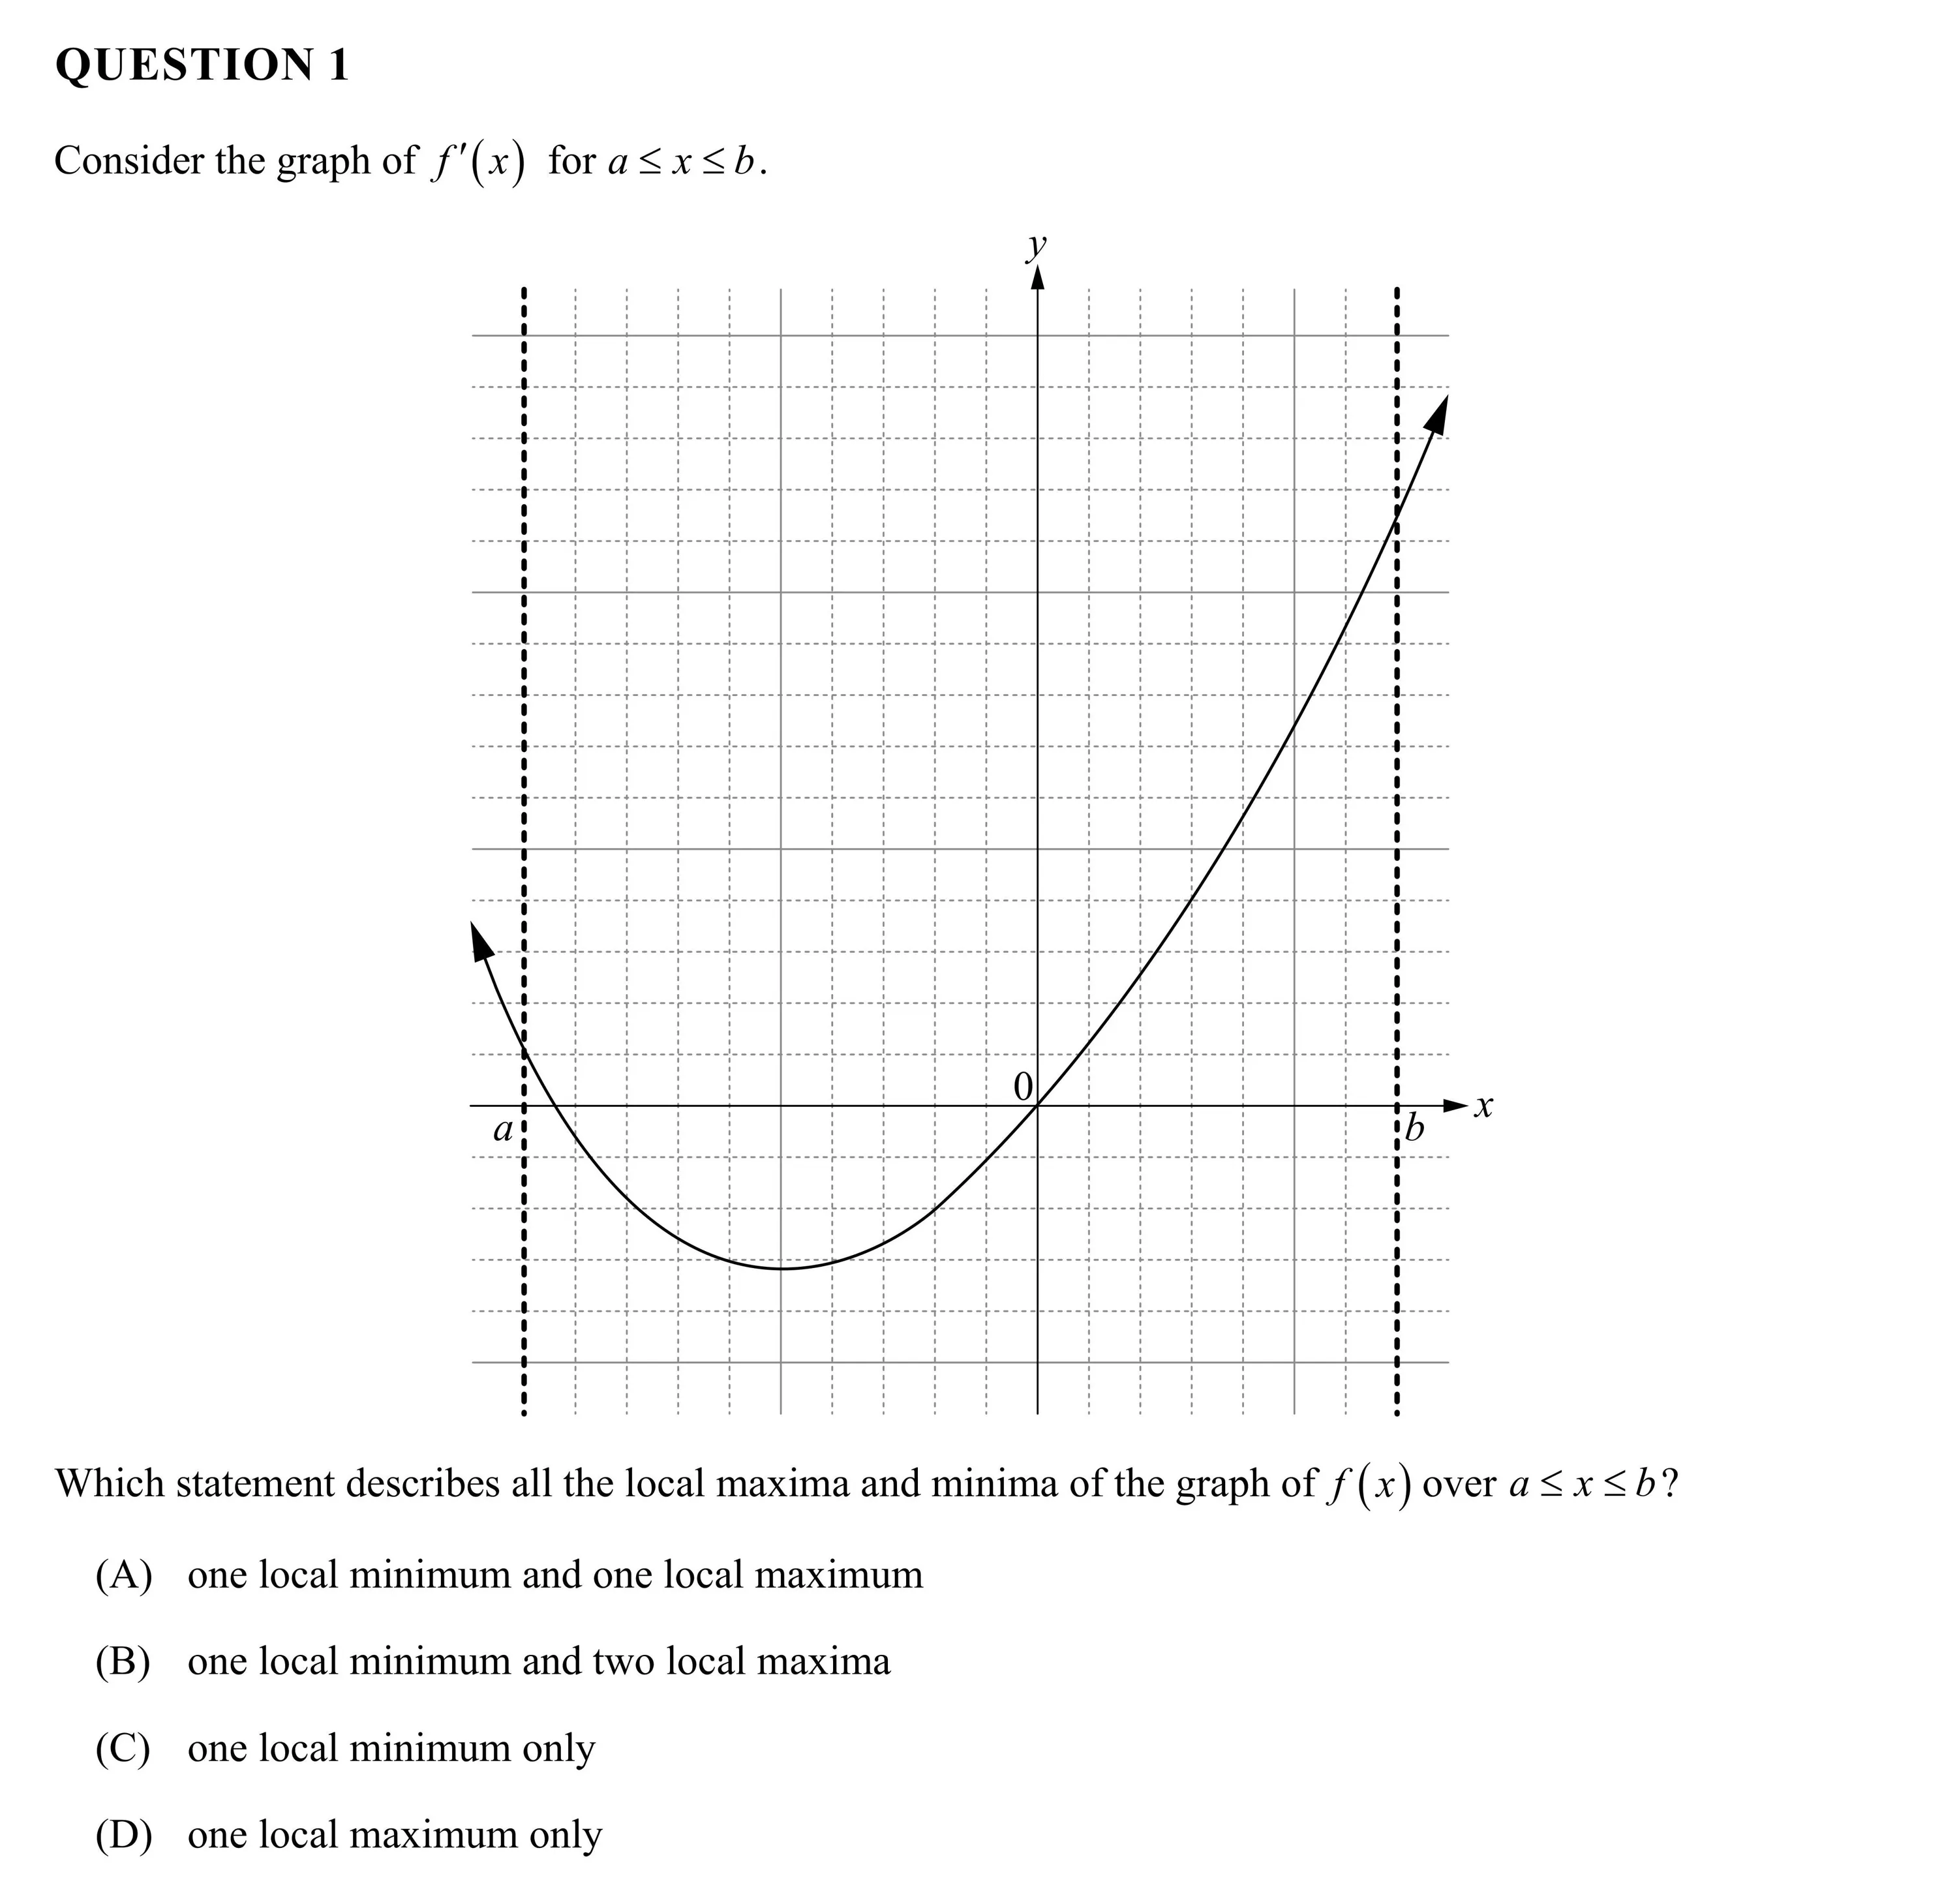
QUESTION 1 Consider the graph of f”(x) for a <x<b. cooee e - Which statement describes all the local maxima and minima of the graph of f(x) over a <x<b? (A) one local minimum and one local maximum (B) one local minimum and two local maxima (C) one local minimum only (D) one local maximum only
QUESTION 2 A binomial random variable arises from the number of successes in n independent Bernoulli trials. A context not suitable for modelling using a binomial random variable is recording the number of (A) heads when a coin is tossed 12 times. (B) left-handed people in a sample of 100 people. (C) times a player hits a target from 20 shots where each shot is independent of all other shots. (D) red marbles selected when three marbles are drawn without replacement from a bag containing four blue and five red marbles.
QUESTION 3 The area between the curve y =9 — x” and the x-axis is (A) 12 units® (B) 18 units® (C) 36 units? (D) 54 units?
QUESTION 4 The weekly amount of money a company spends on repairs is normally distributed with a mean of $1200 and a standard deviation of $100. Given that P(Z <-2.5) =0.0062 and P(Z >1) = 0.1587 where Z is a standard normal random variable determine the probability that the weekly repair costs will be between $950 and $1300. (A) 0.6525 (B) 0.6587 (C) 0.8351 (D) 0.8413
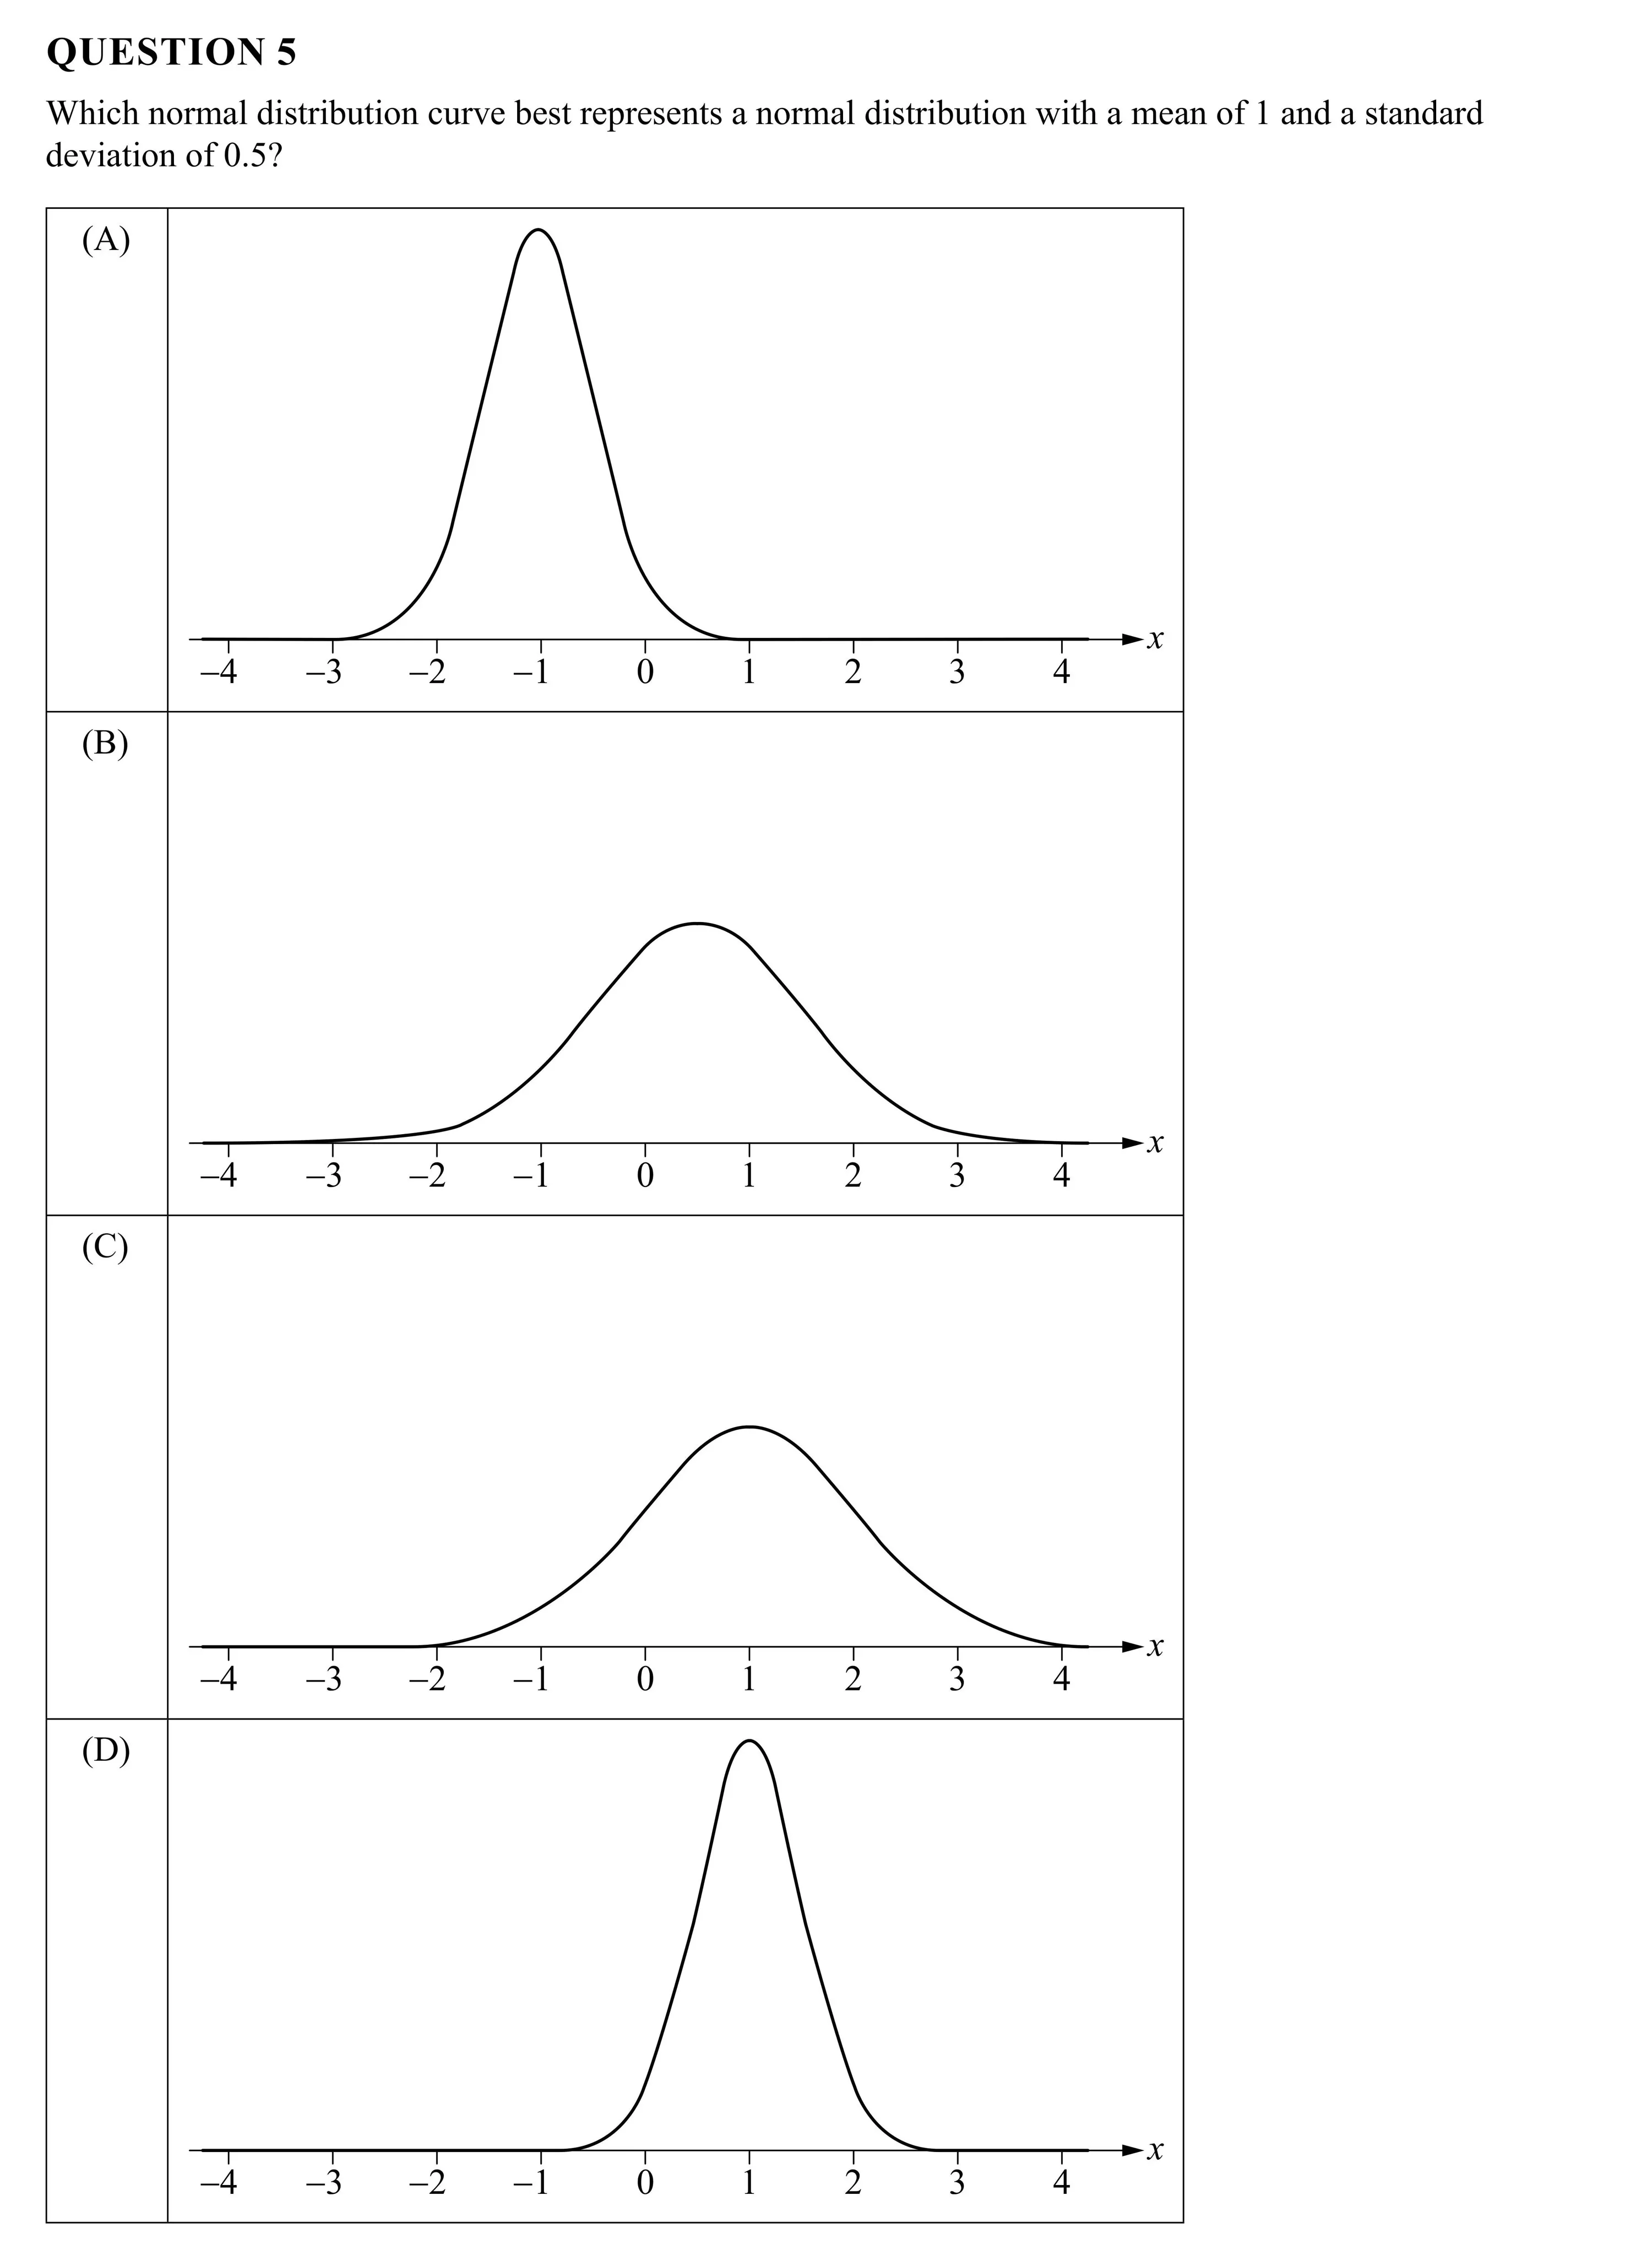
QUESTION 5 Which normal distribution curve best represents a normal distribution with a mean of 1 and a standard deviation of 0.5?
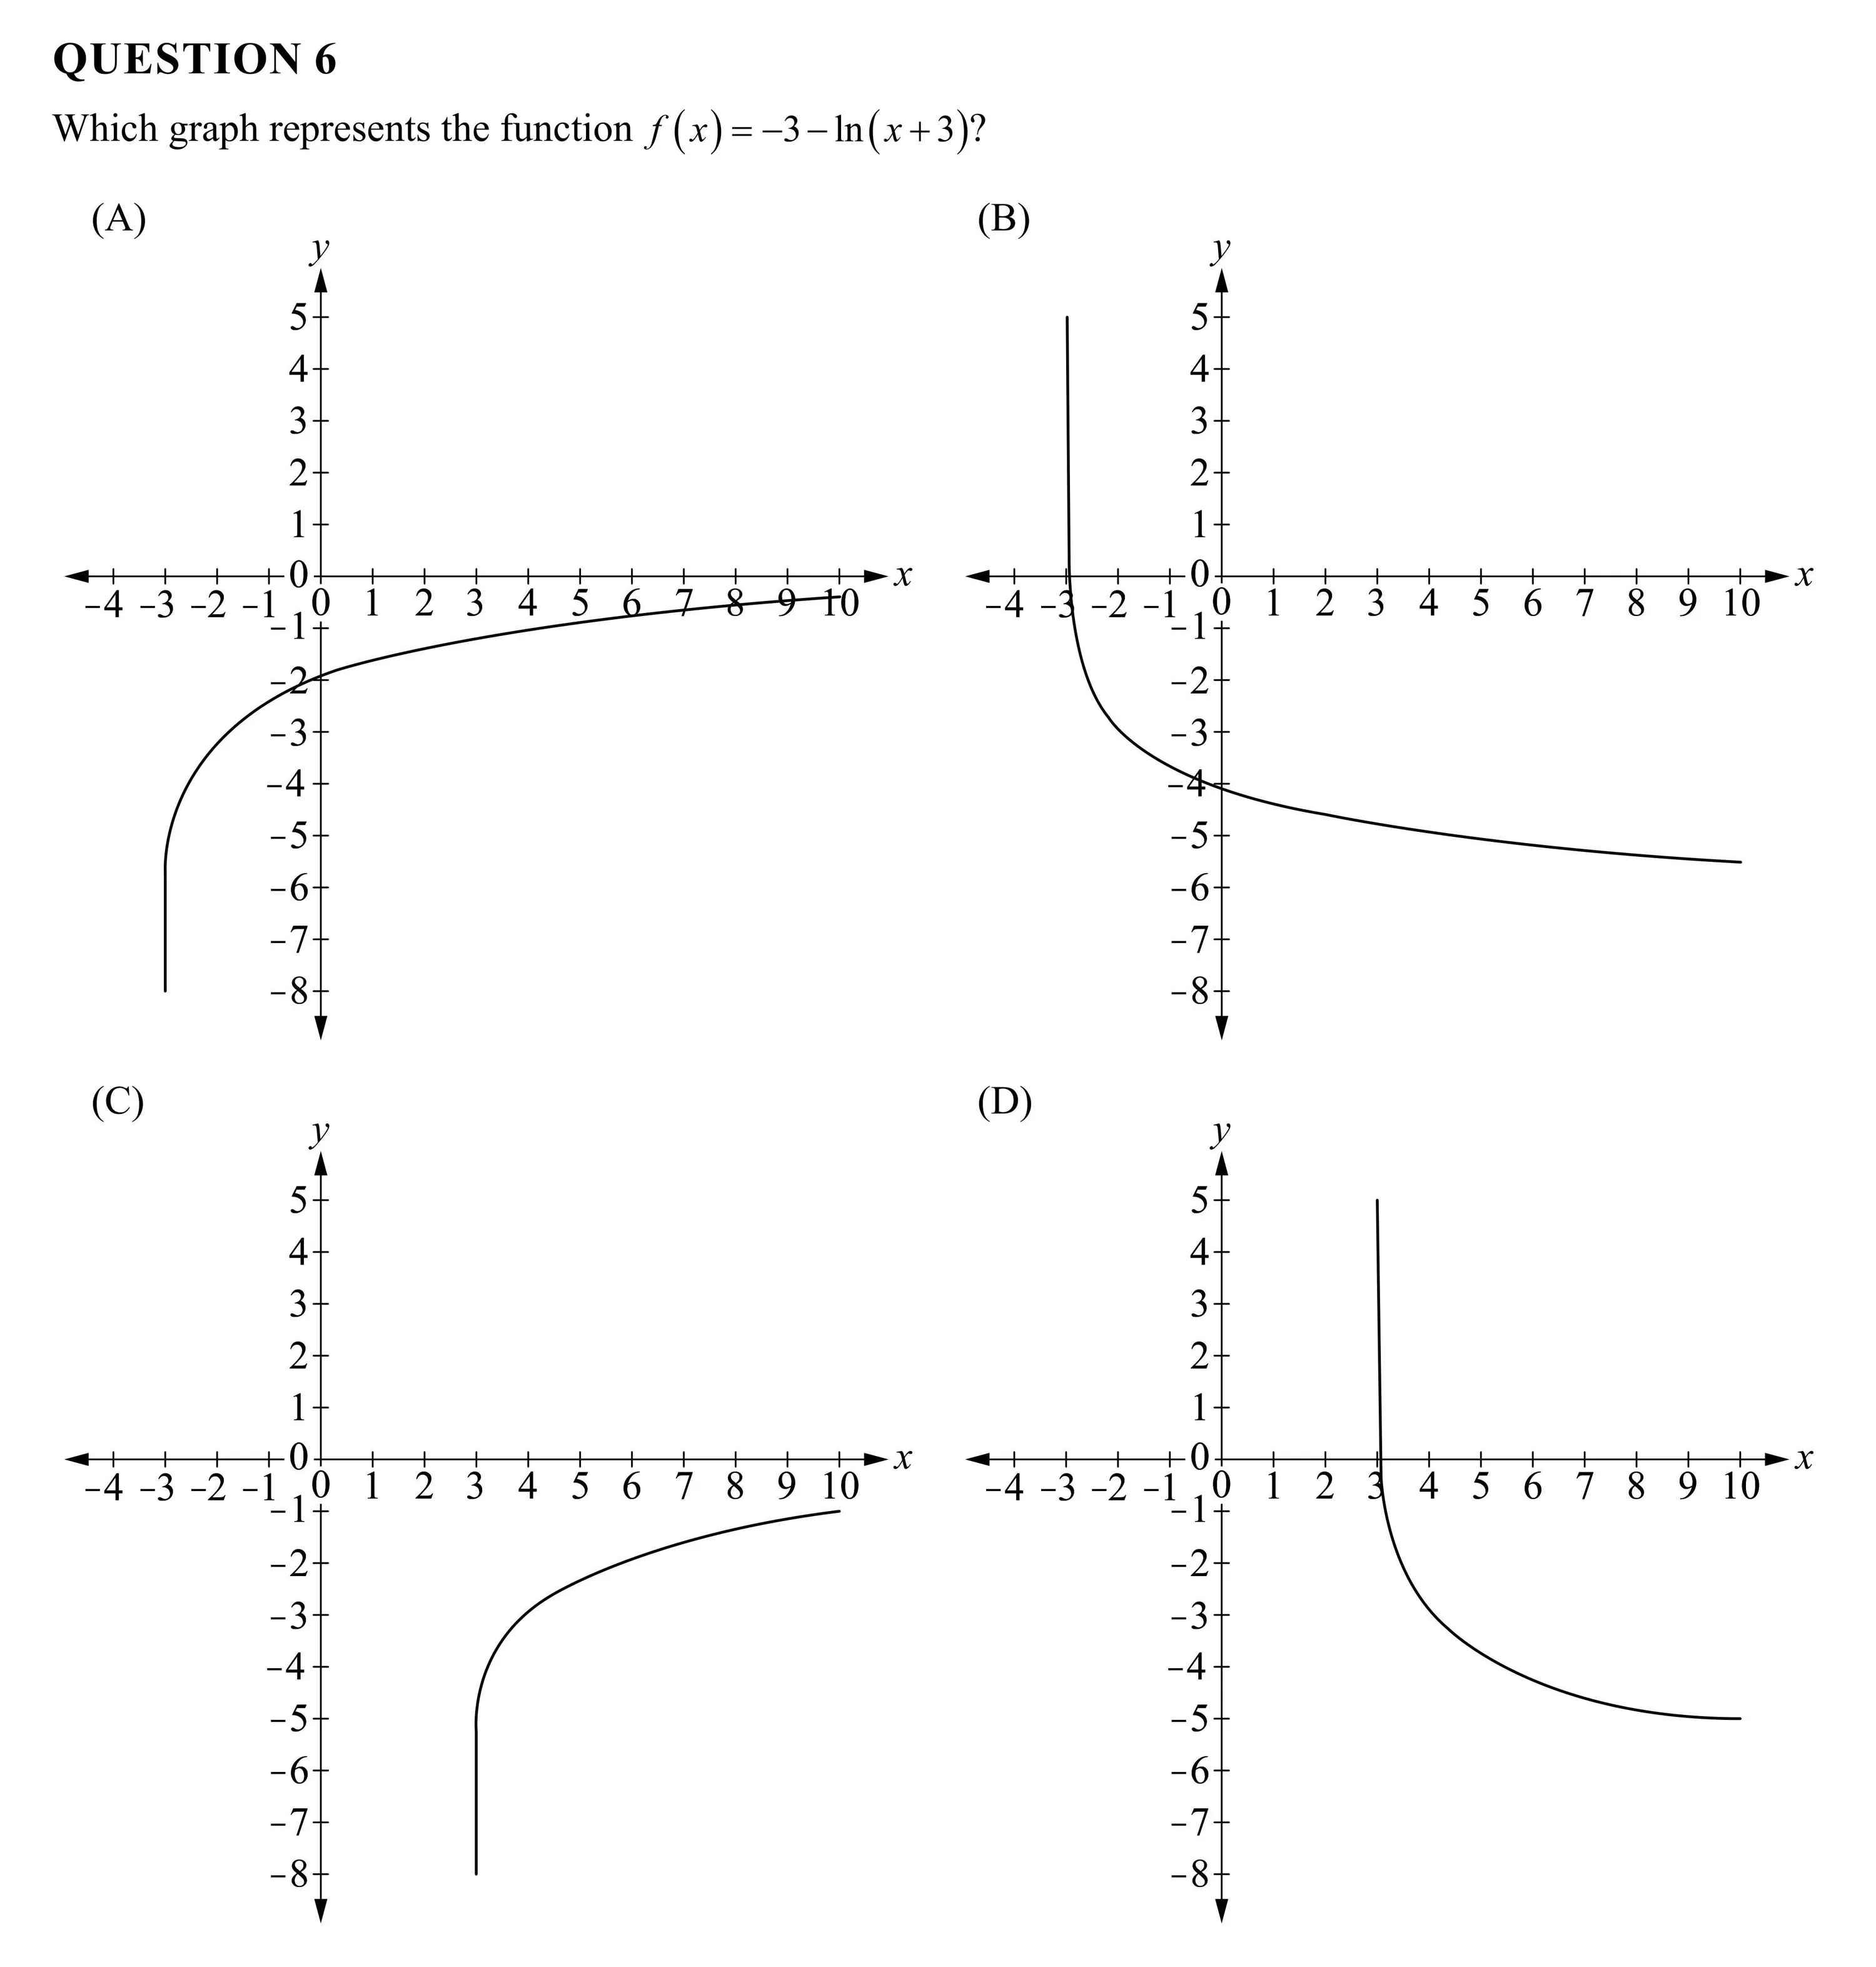
QUESTION 6 Which graph represents the function f(x)=-3—In(x+3)? (A) (B) -—+—+—+—+0 —43211012345 (D) Y 5 4 3 2 1 O 0 -— X -4 -3 -2 -1 1 23456 728 910 -4-3-2-1.0 1 2 4 56 78 910 3 -1 B %)) -3 -3 -4 -4 -5 -5 -6 -6 -7 7 -8 -8 —_ N W KA W -1.01 234567238910 © —_— N W KA WD
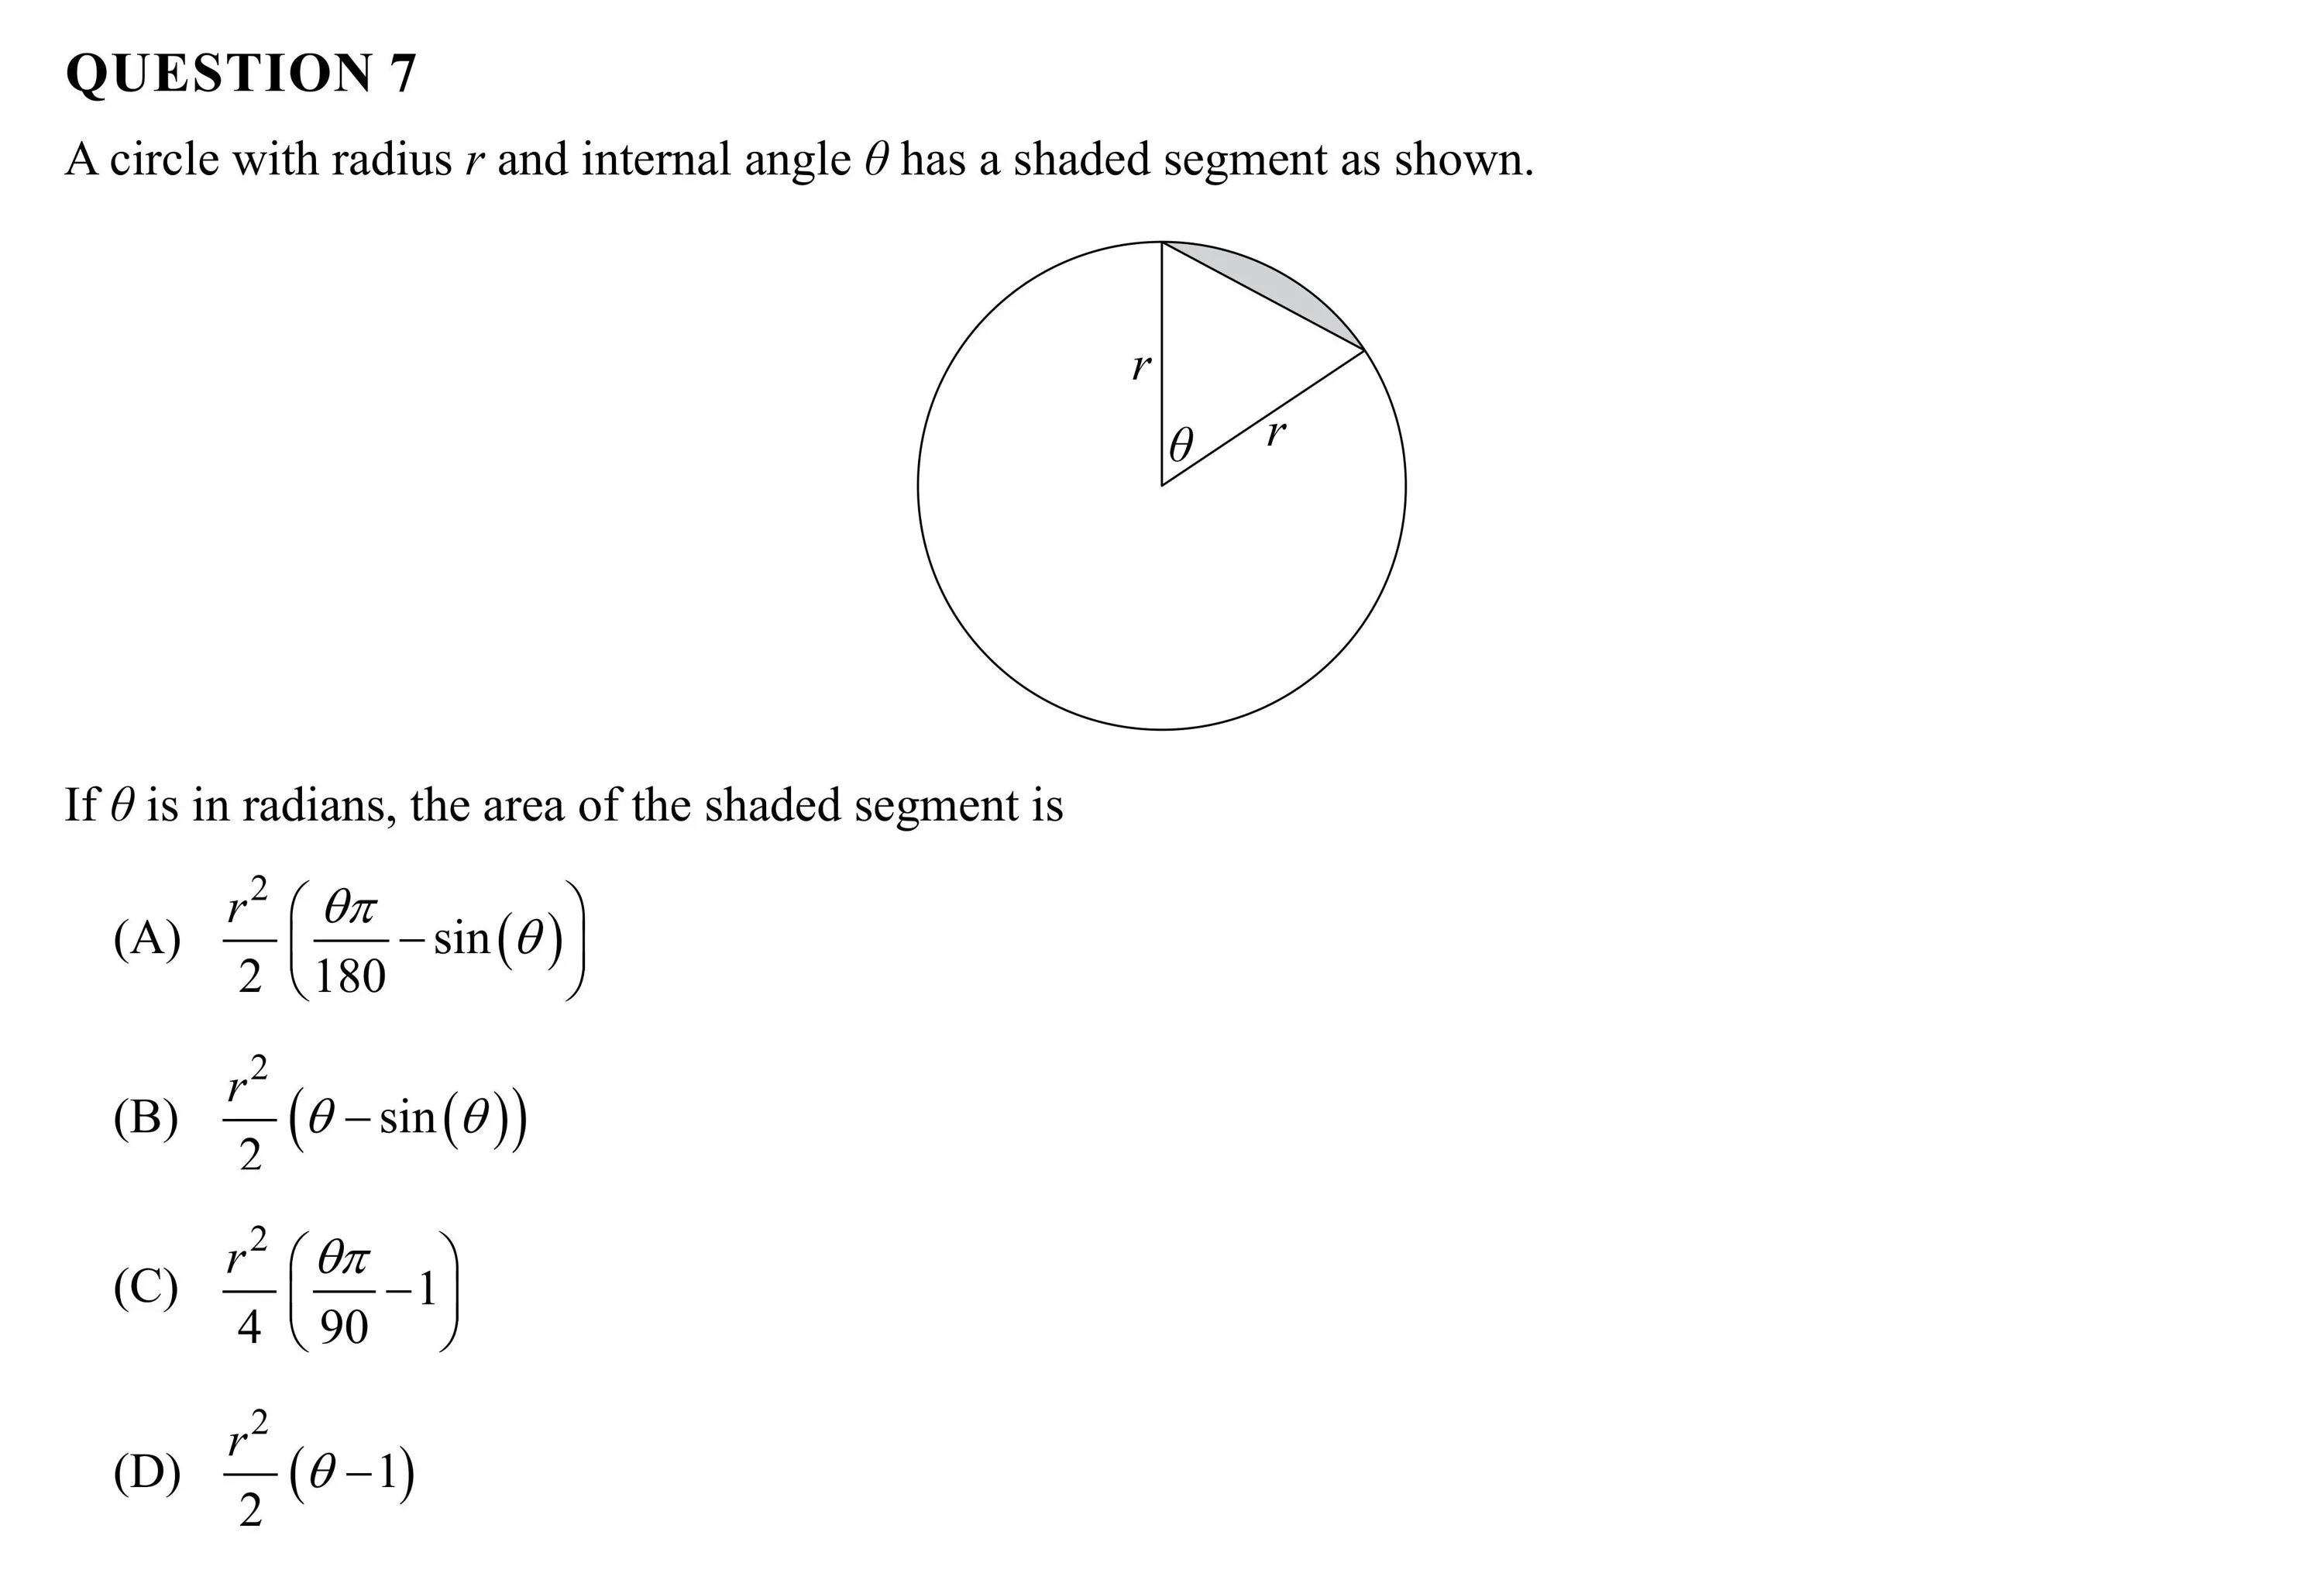
QUESTION 7 A circle with radius 7 and internal angle 6 has a shaded segment as shown. = If 4 1s in radians the area of the shaded segment is B) —(0-sin(0)) 0 2[5 (D) %(9—1)
QUESTION 8 In a survey 80 respondents exercised daily while 120 did not. When calculating the approximate 95% confidence interval for the proportion of people who exercise daily the margin of error 1s 0.4(1-0.4) (A) 1.96 ——— 200 0.4(1-0.4) (B) 0.95——— 200 0.67(1-0.67) C) 1.96 |——— © 120 0.67(1—0.67) (D) 0.95 |————= 120
QUESTION 9 The approximate area under the curve f (x) =+/2x +1 between x = 0 and x = 4 using the trapezoidal rule with four strips is (A) 2+-B+5+47 B) 2+2(V3+5+7) () 4+2(\B+£+\fi) (D) 4+3+5+47
QUESTION 10 A survey plans to draw conclusions based on a random sample of 1% of Queensland`s adult population. To be regarded as a random sample every (A) adult in the population will be placed in an alphabetical list and every 100th person will be selected for the sample. (B) adult in the population can choose to participate until the sample size has been reached. (C) subgroup within the population will be represented in a similar proportion in the sample. (D) adult in the population will have an equal chance of being selected for the sample.
QUESTION 11 (5 marks) Solve for x in the following. a) ln(2x) =3 [2 marks] b) log (4x+16)log (x* —2)=1 [3 marks]
QUESTION 12 (3 marks) The probability that a debating team wins a debate can be modelled as a Bernoulli distribution. Given that the probability of winning a debate is 3 a) Determine the mean of this distribution. [1 mark] b) Determine the variance of this distribution. [1 mark] c¢) Determine the standard deviation of this distribution. [1 mark]
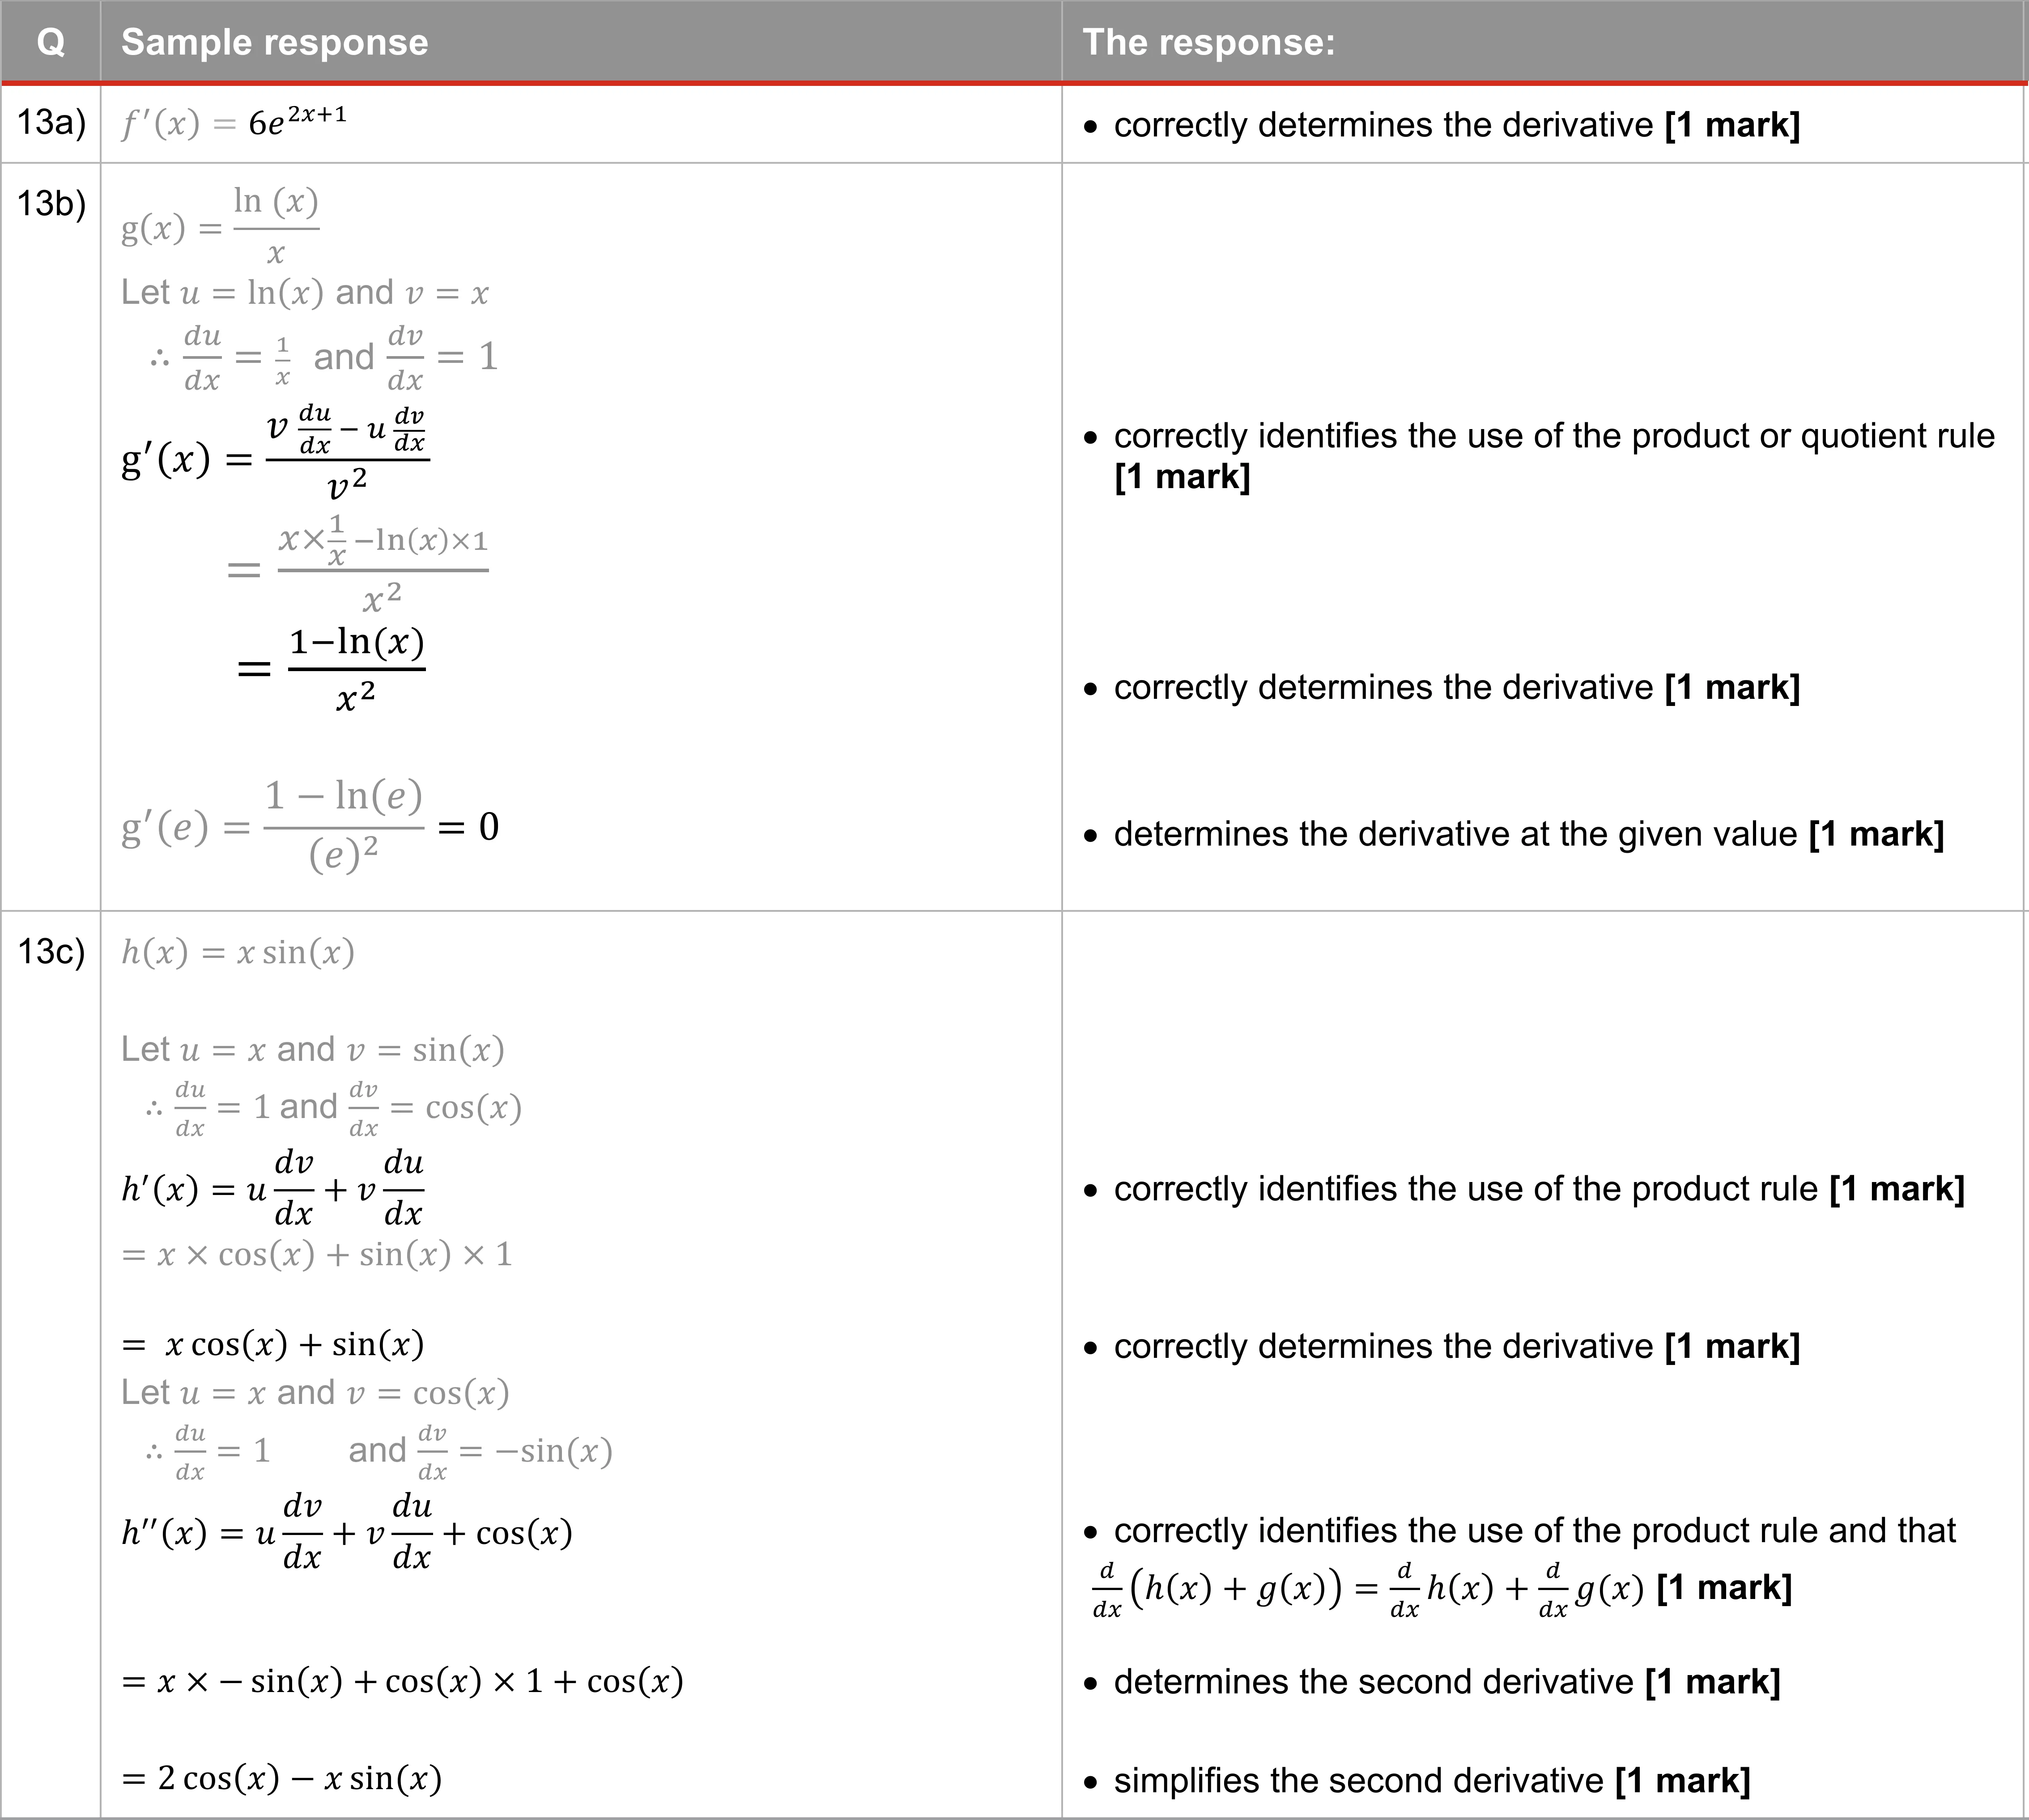
QUESTION 13 (9 marks) a) Determine the derivative of f`(x)= 32 [1 mark] : ln(x) : : b) Given that g(x)=——= determine the simplest value of g`(e). [3 marks] X ¢) Determine the second derivative of 4(x) = xsin(x). (Give your answer in simplest form.) /5 marks]
QUESTION 14 (6 marks) The rate that water fills an empty vessel is given by L 0.25¢ * (in litres per hour) 0 <t <8In(6) where ¢ is time (in hours). dt a) Determine the function that represents the volume of water in the vessel (in litres). [2 marks] The vessel is full when 7 = 81n(6). b) Determine the volume of water to the nearest litre the vessel can hold when full. [2 marks] The table shows the approximate rate the water flows into the vessel at certain times. c) Use information from the table and the trapezoidal rule to determine the approximate volume of water in the vessel after three hours. [2 marks]
QUESTION 15 (4 marks) The derivative of a function 1s given by f `(x) =e* (x — 4). Determine the interval on which the graph of f (x) is both decreasing and concave up.
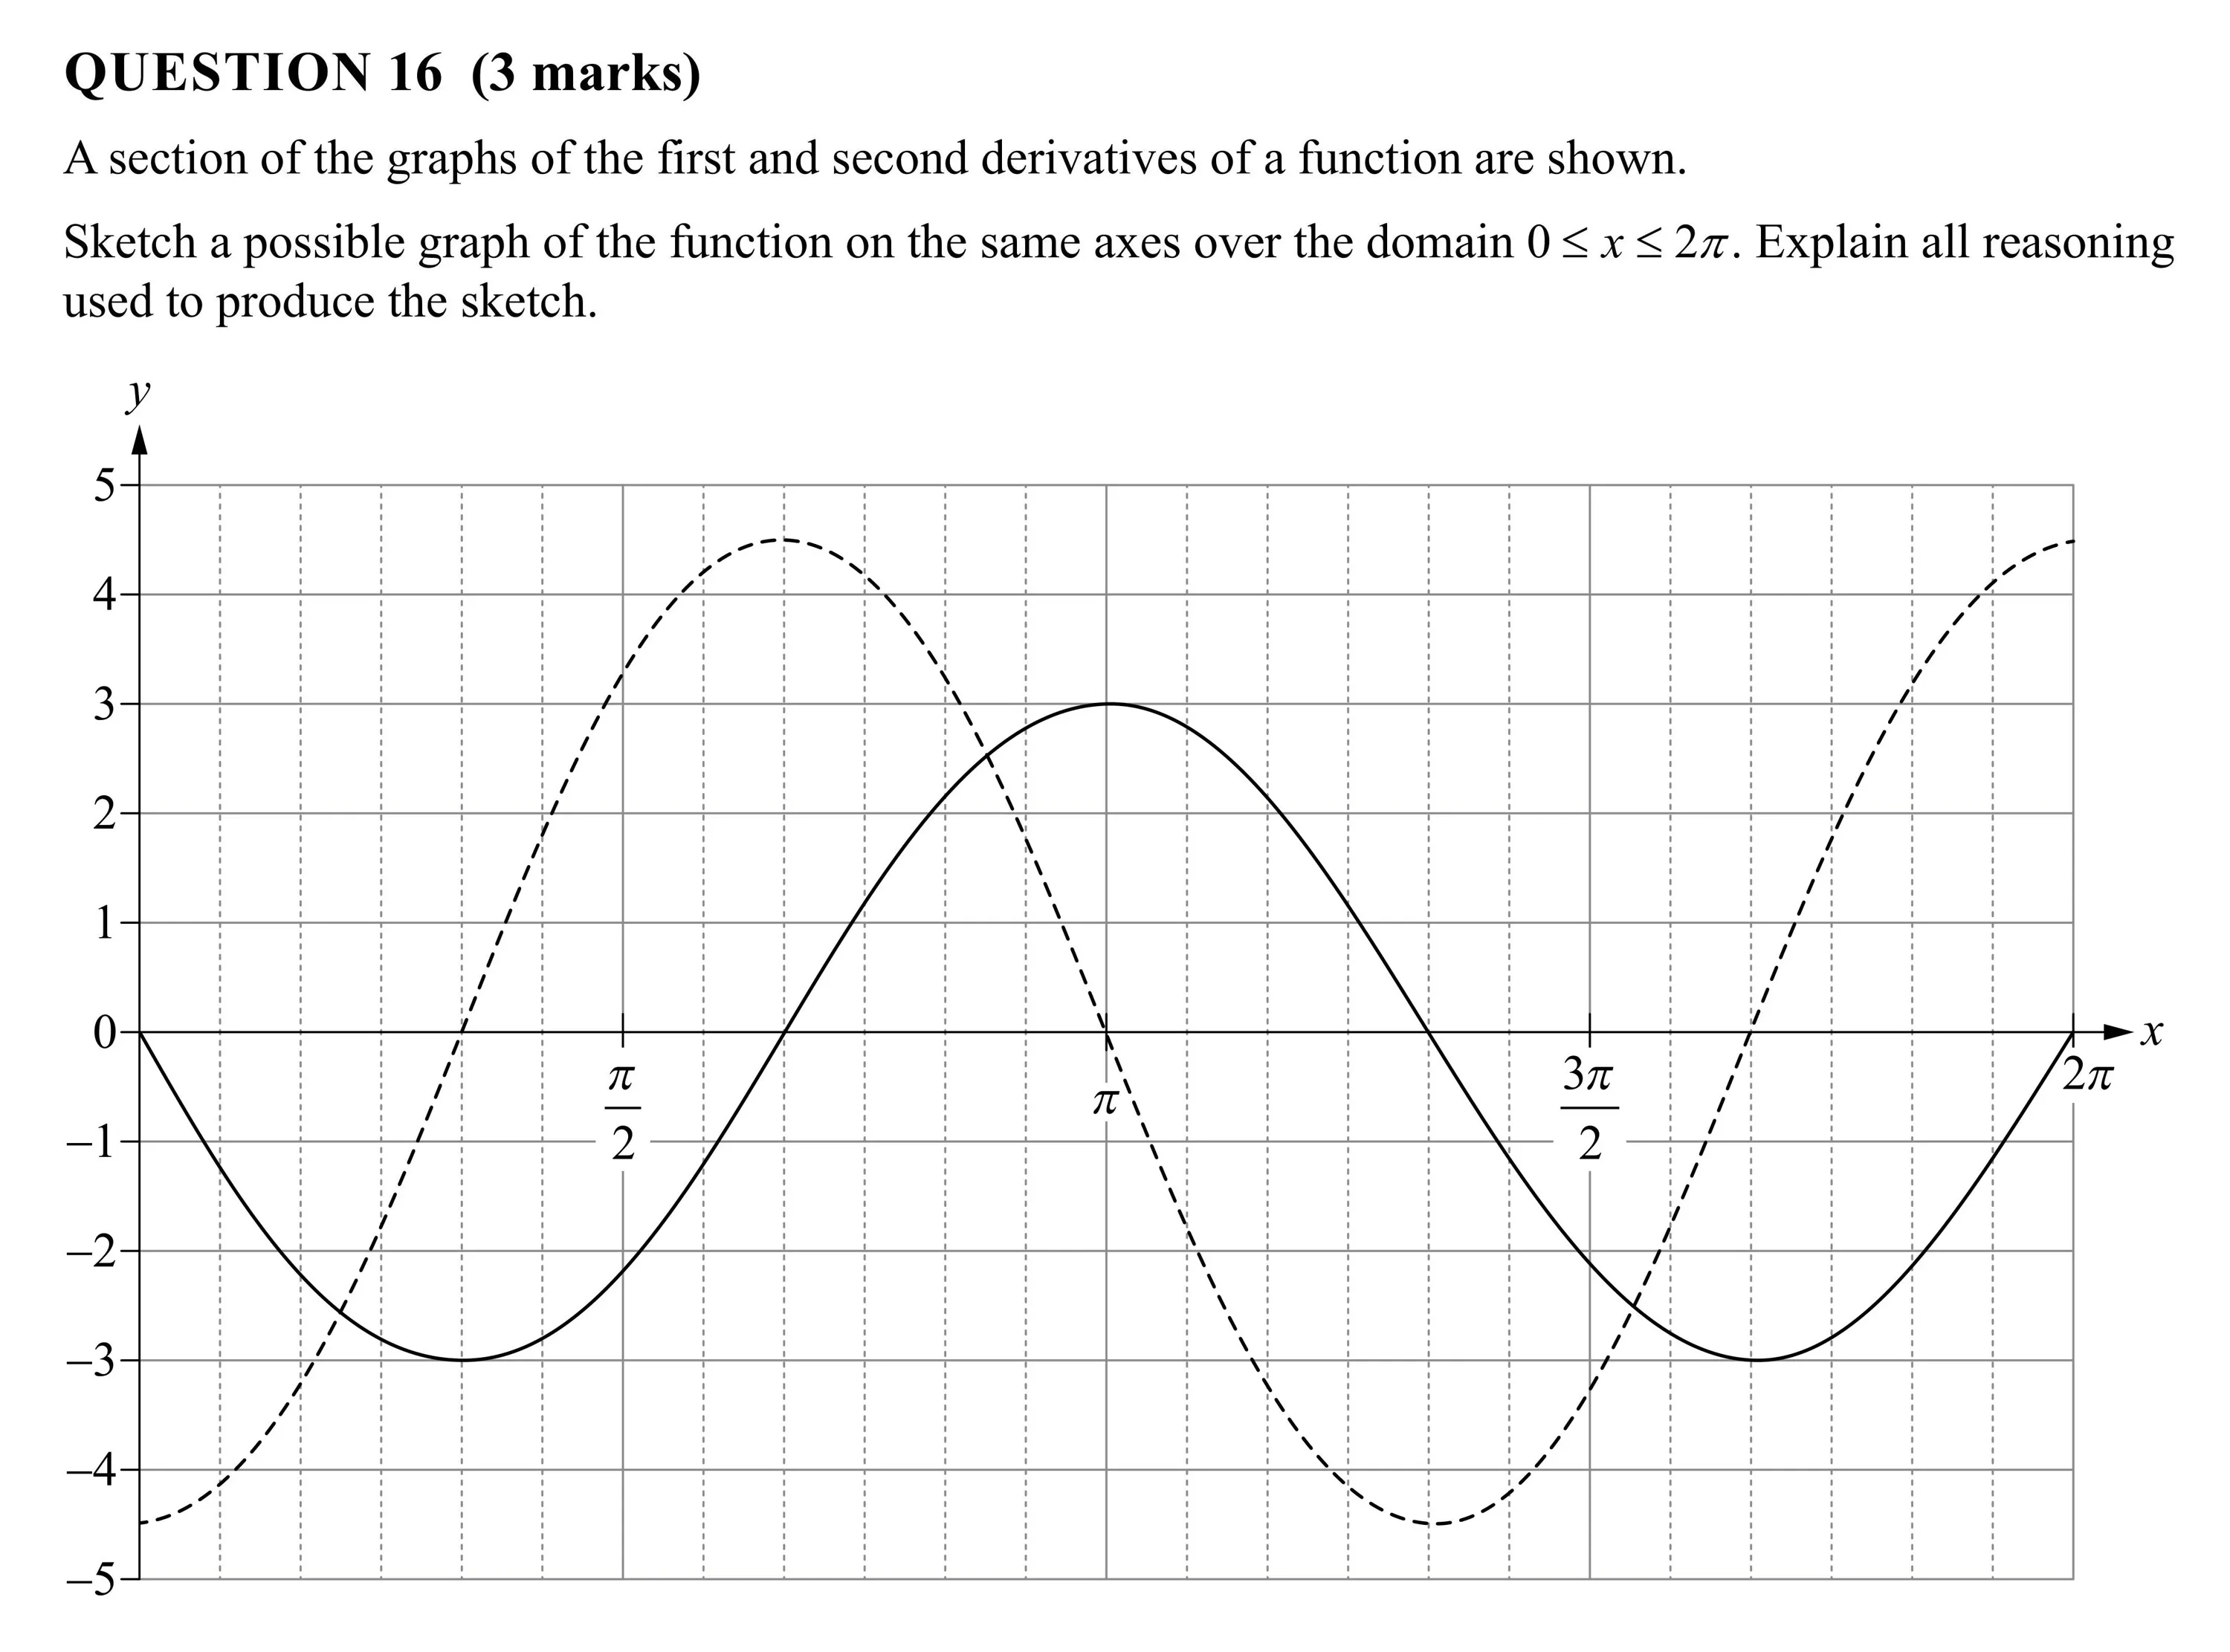
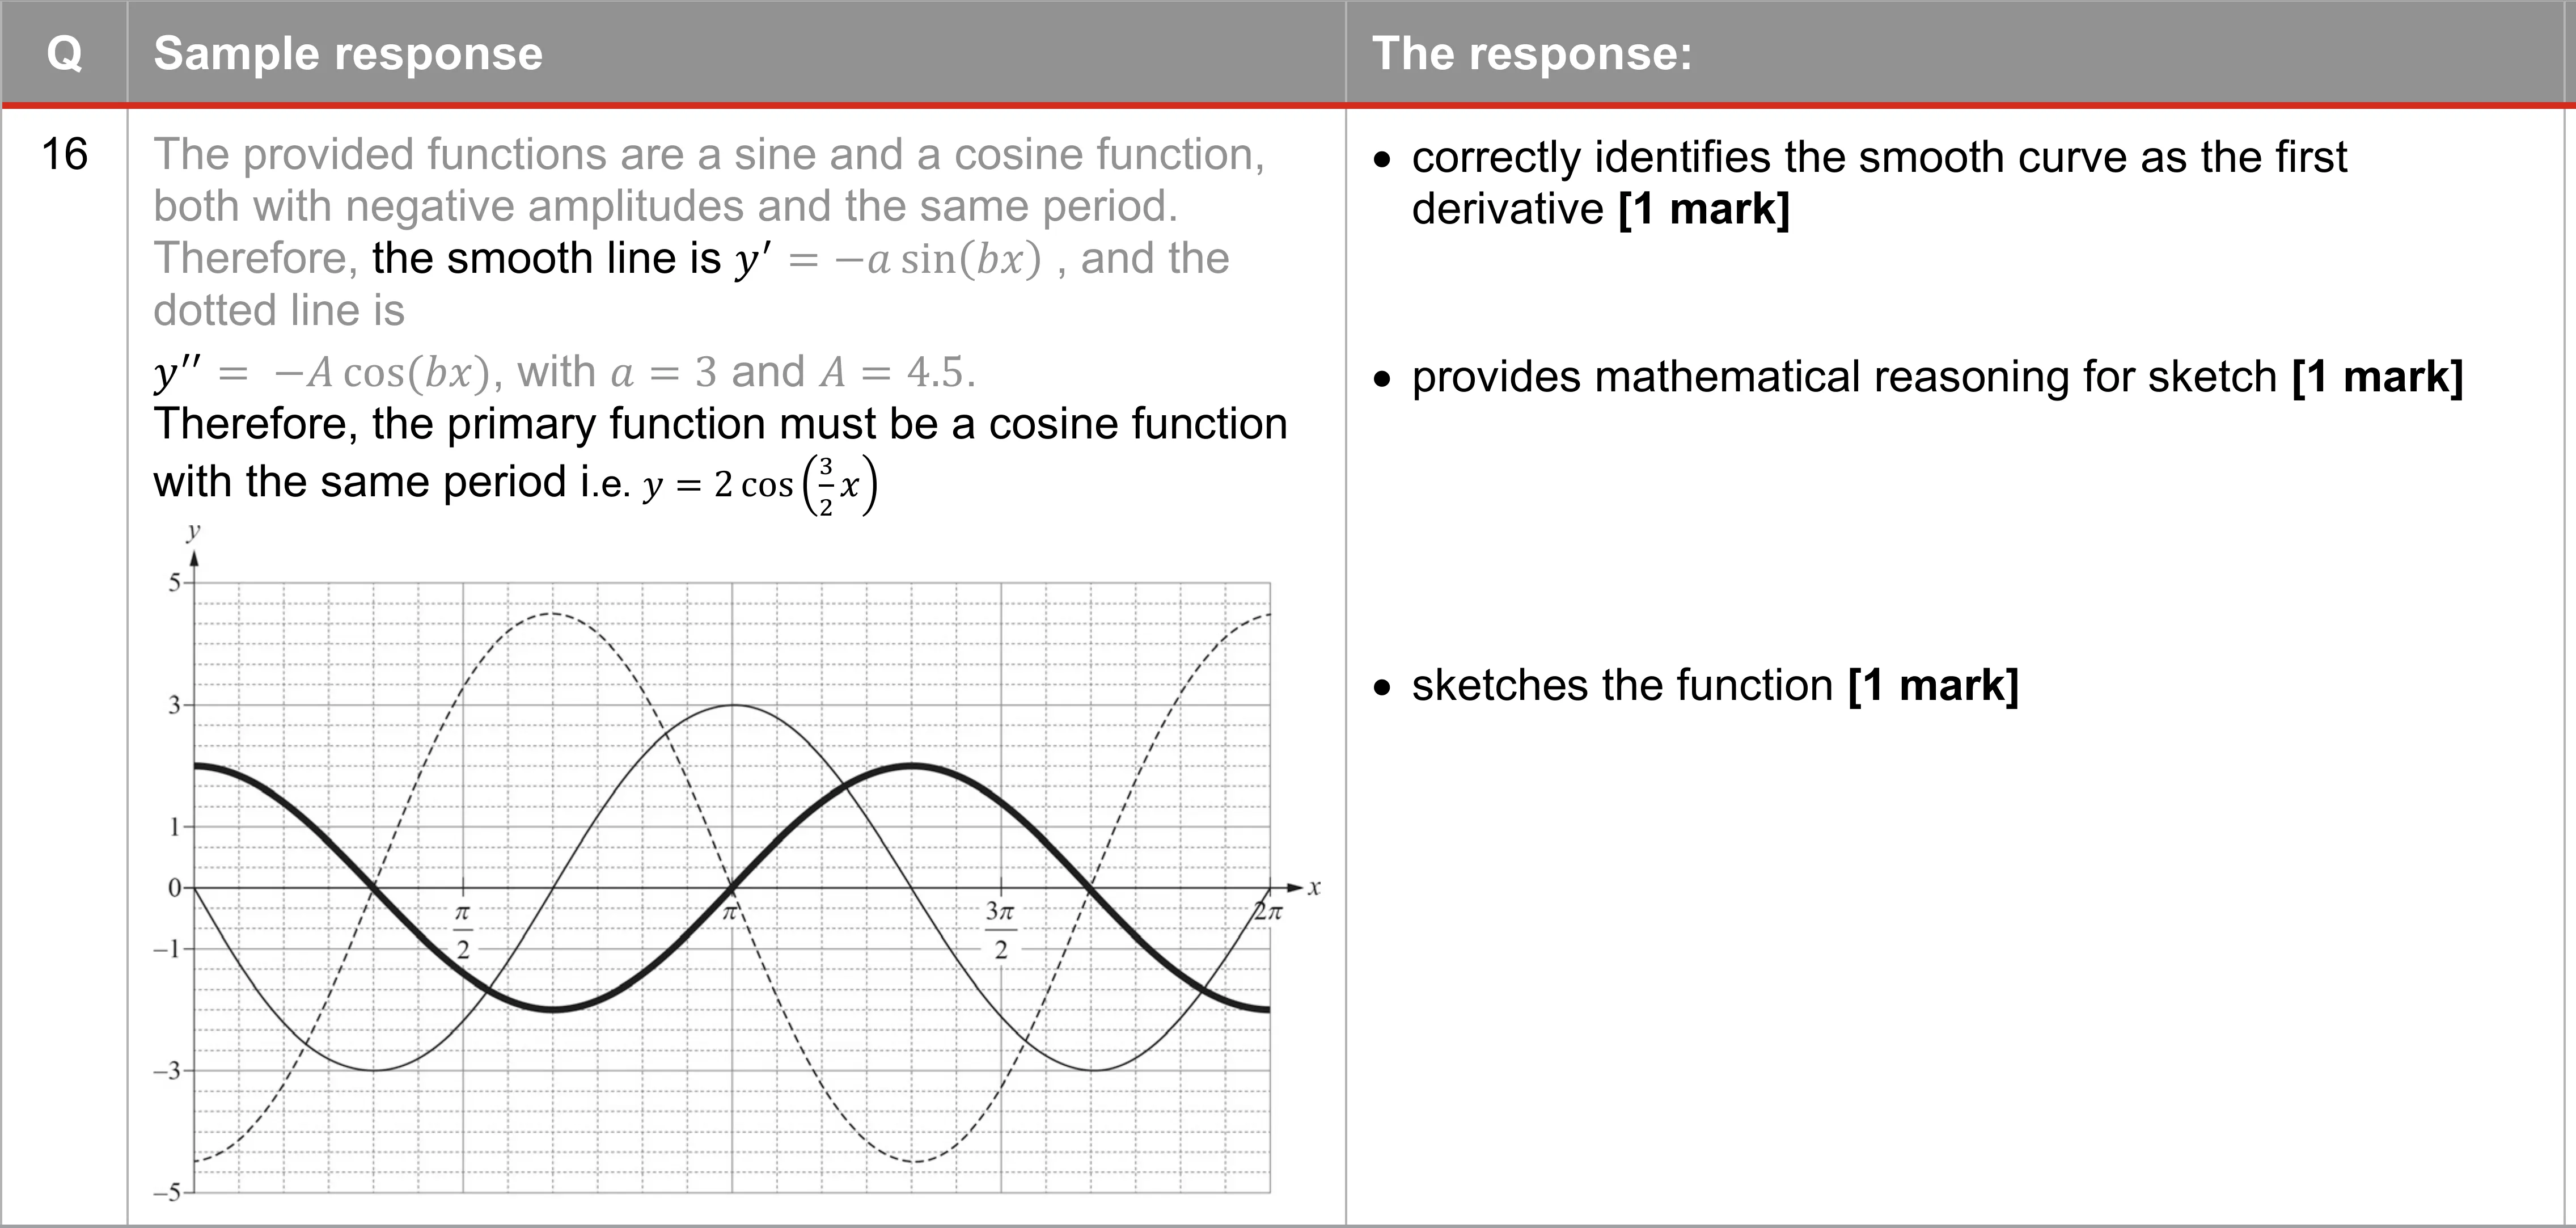
QUESTION 16 (3 marks) A section of the graphs of the first and second derivatives of a function are shown. Sketch a possible graph of the function on the same axes over the domain 0 < x < 27. Explain all reasoning used to produce the sketch. y
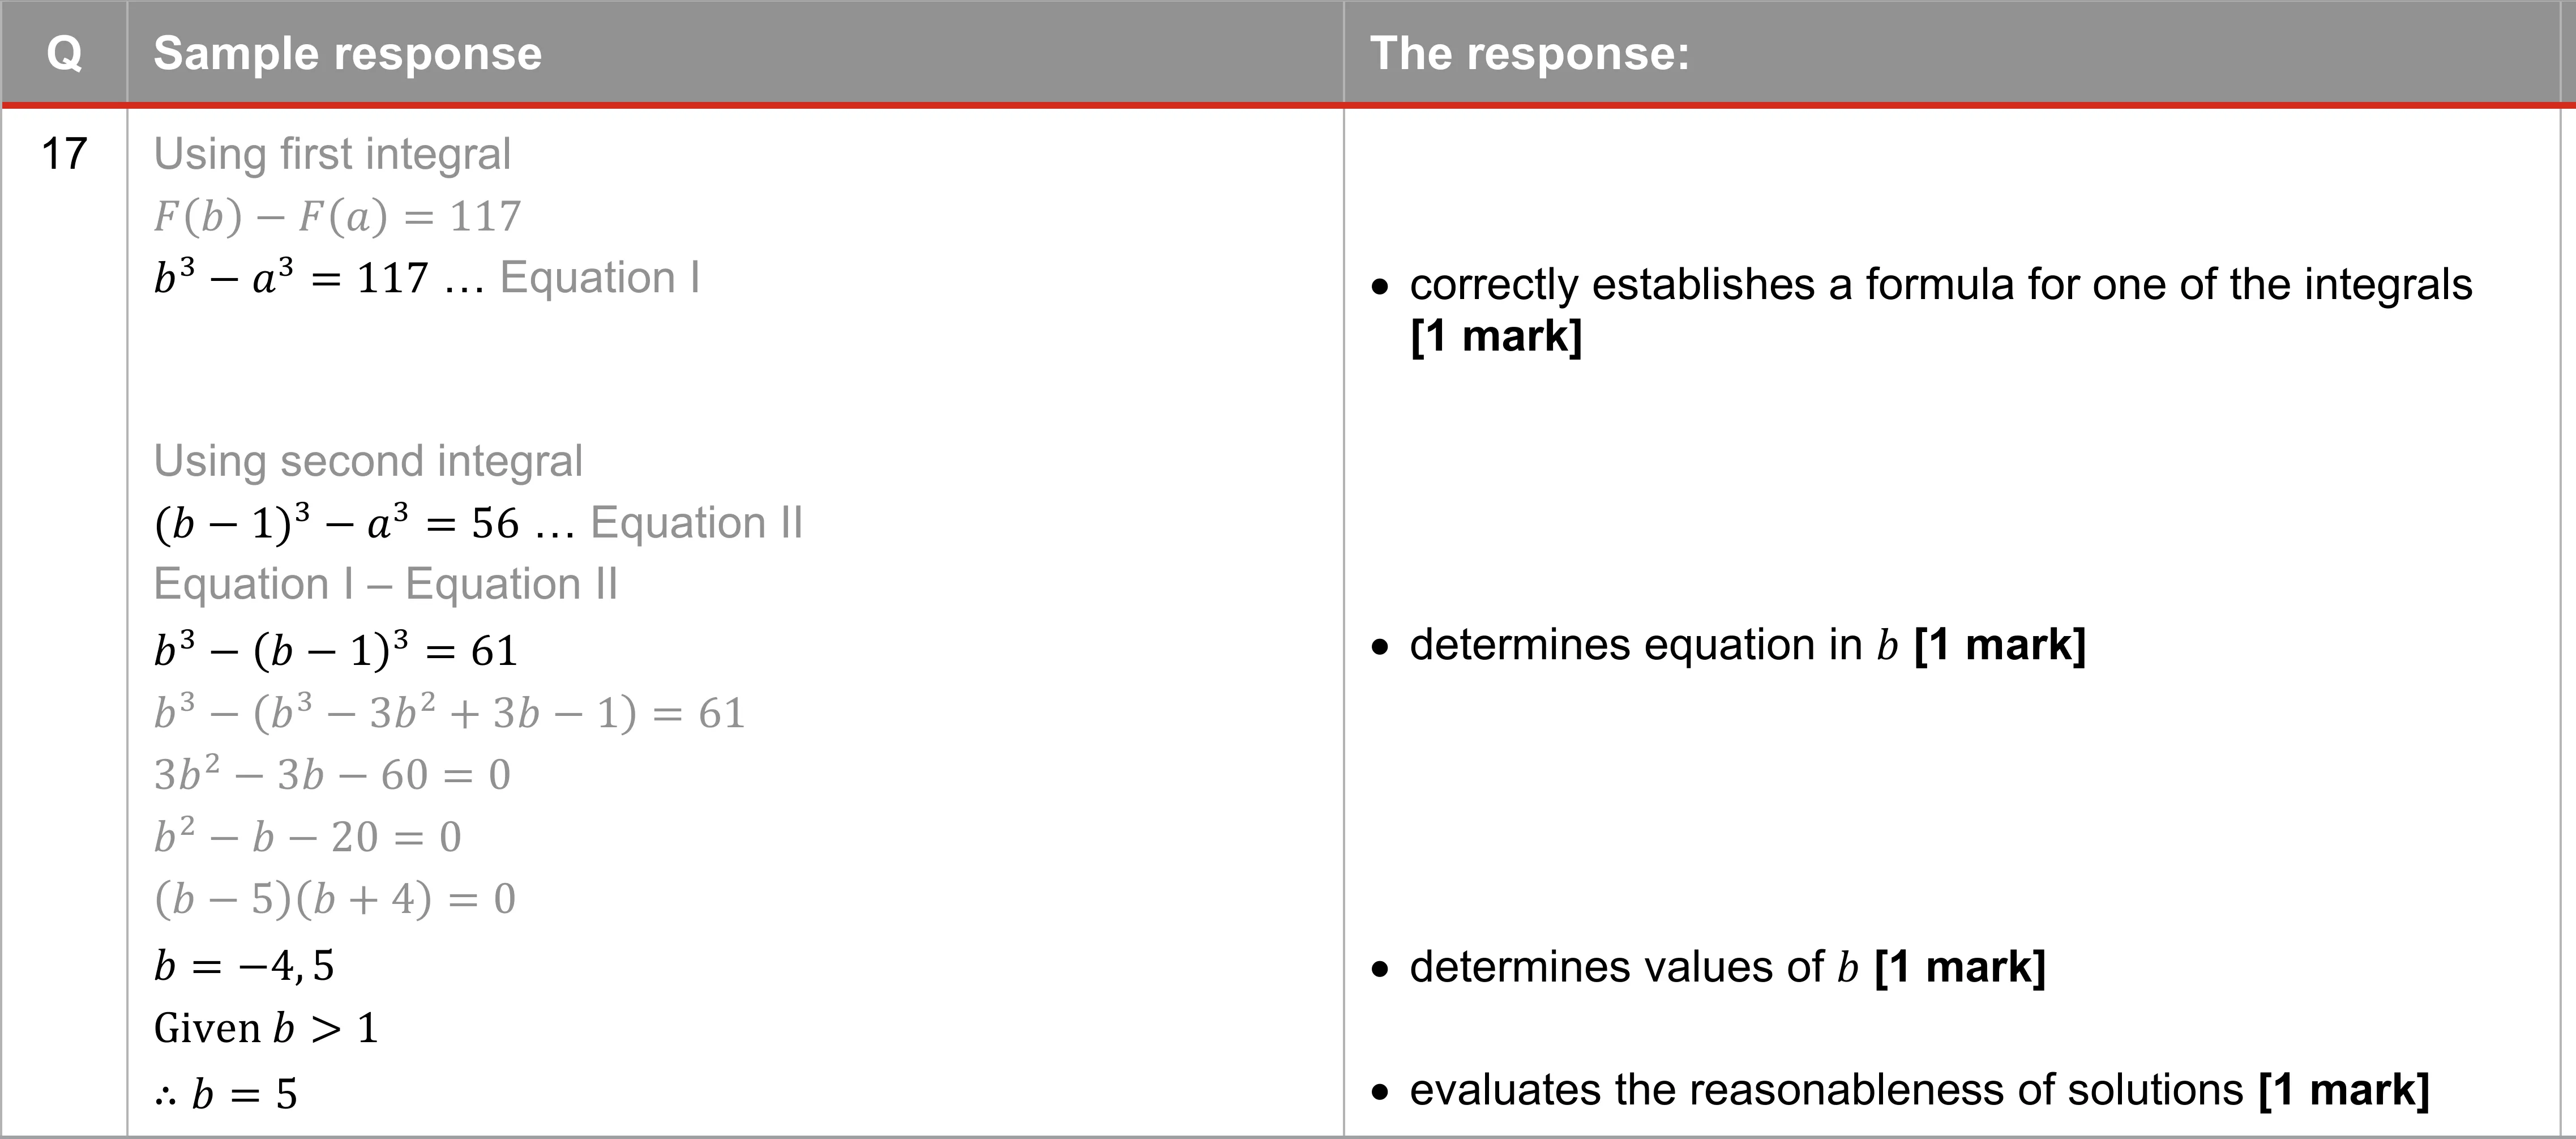
QUESTION 17 (4 marks) . . b b— Determine the value of b given I 3x%dx =117 and I l3x2a`x =56 forb>1. a a
QUESTION 18 (4 marks) A percentile 1s a measure in statistics showing the value below which a given percentage of observations occur. The continuous random variable X has the probability density function 2x—2 1<x<2 f(x)={ 0 otherwise Determine the 36th percentile of X.
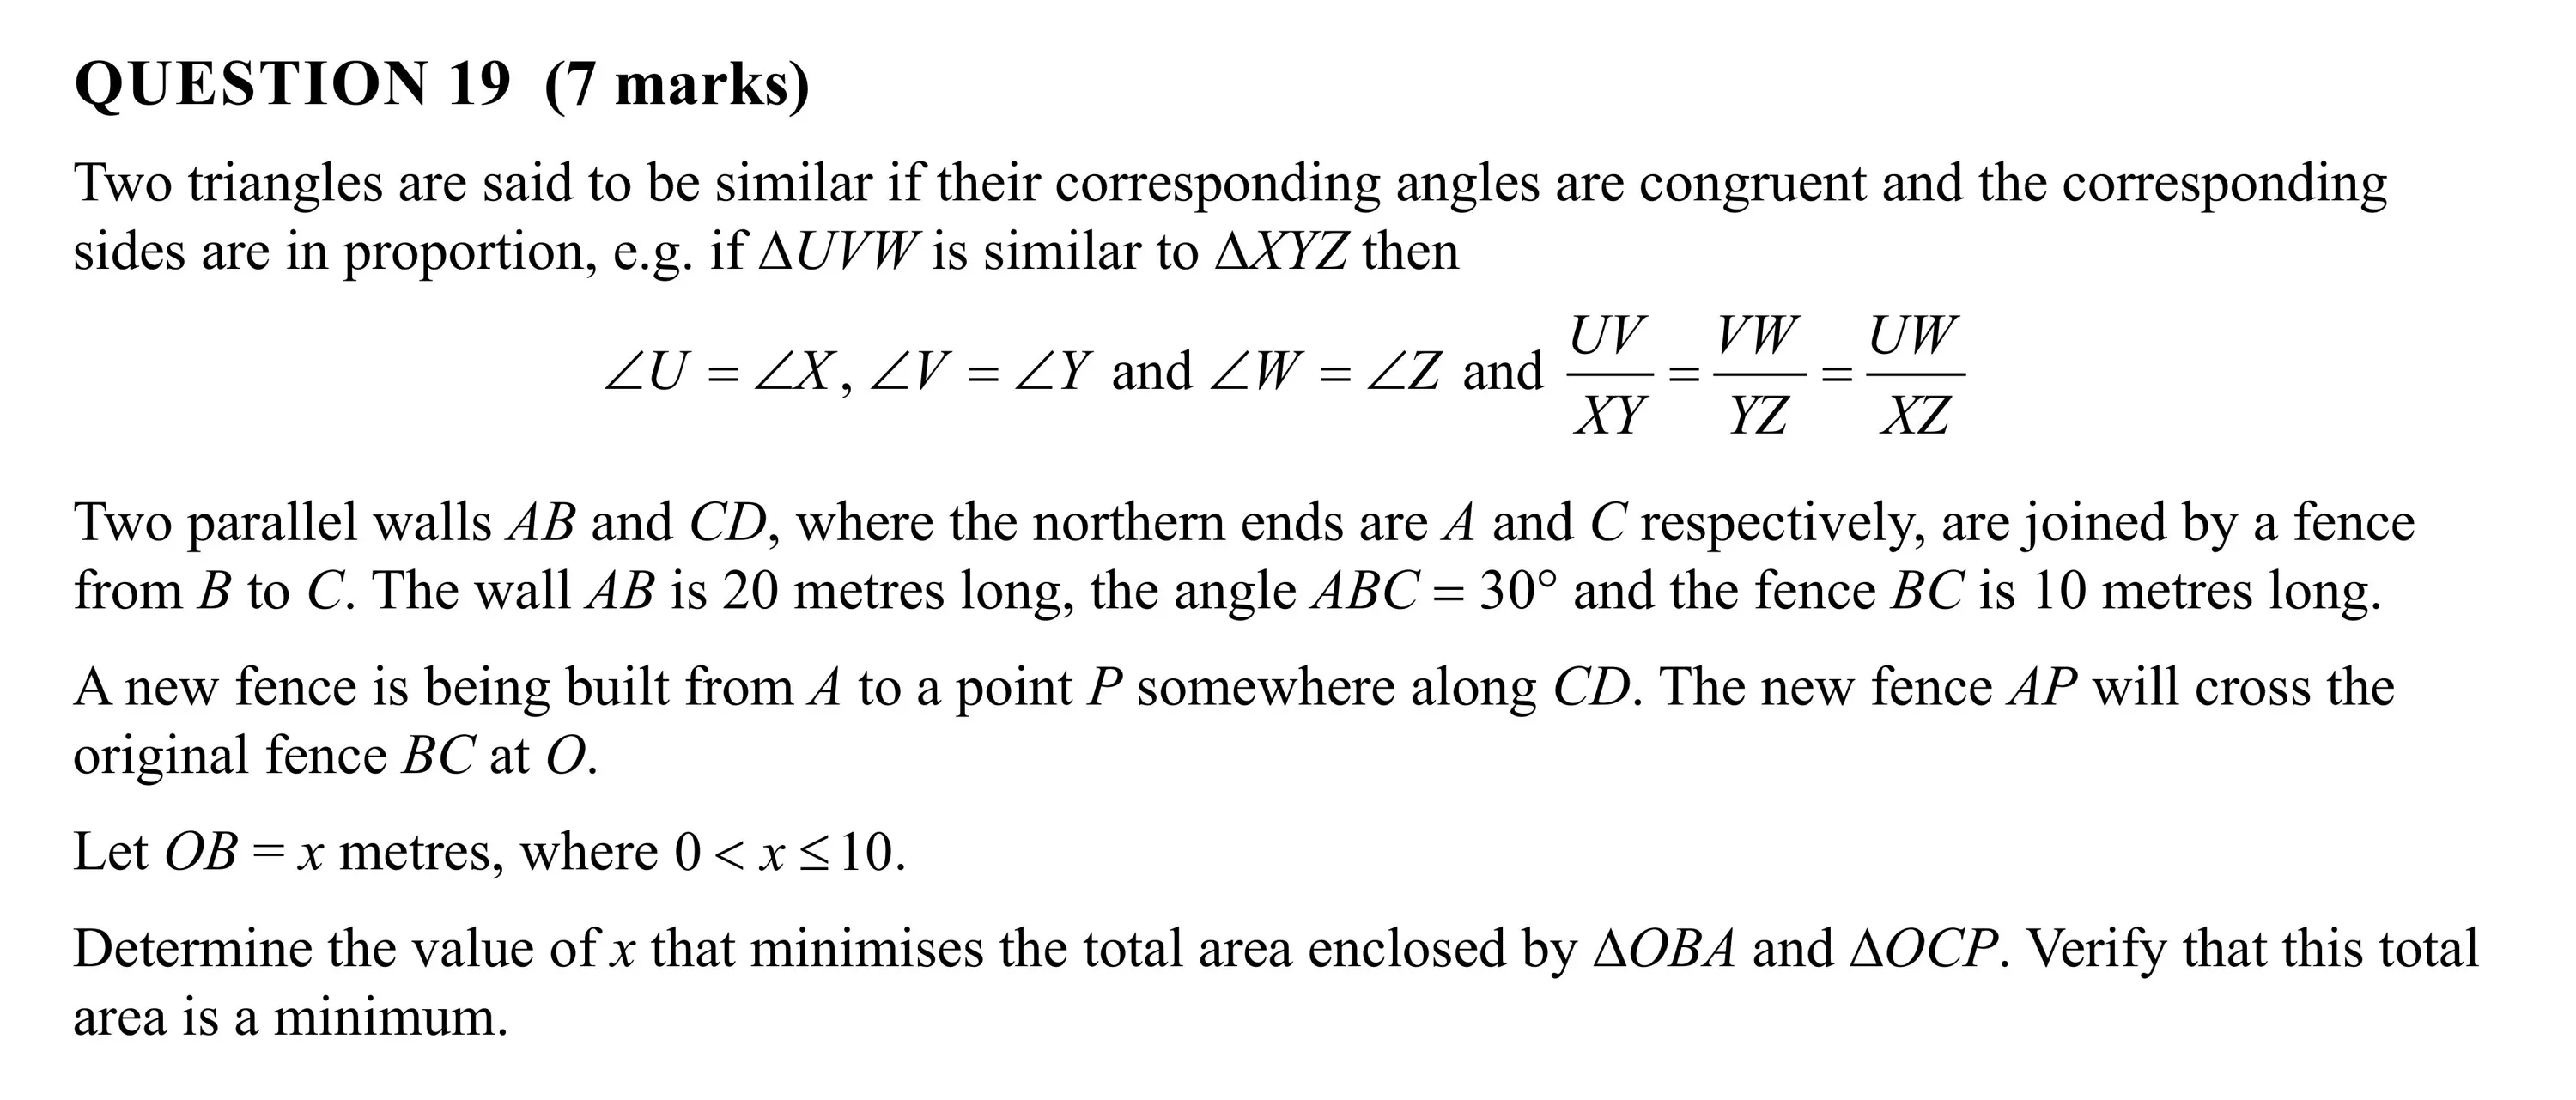
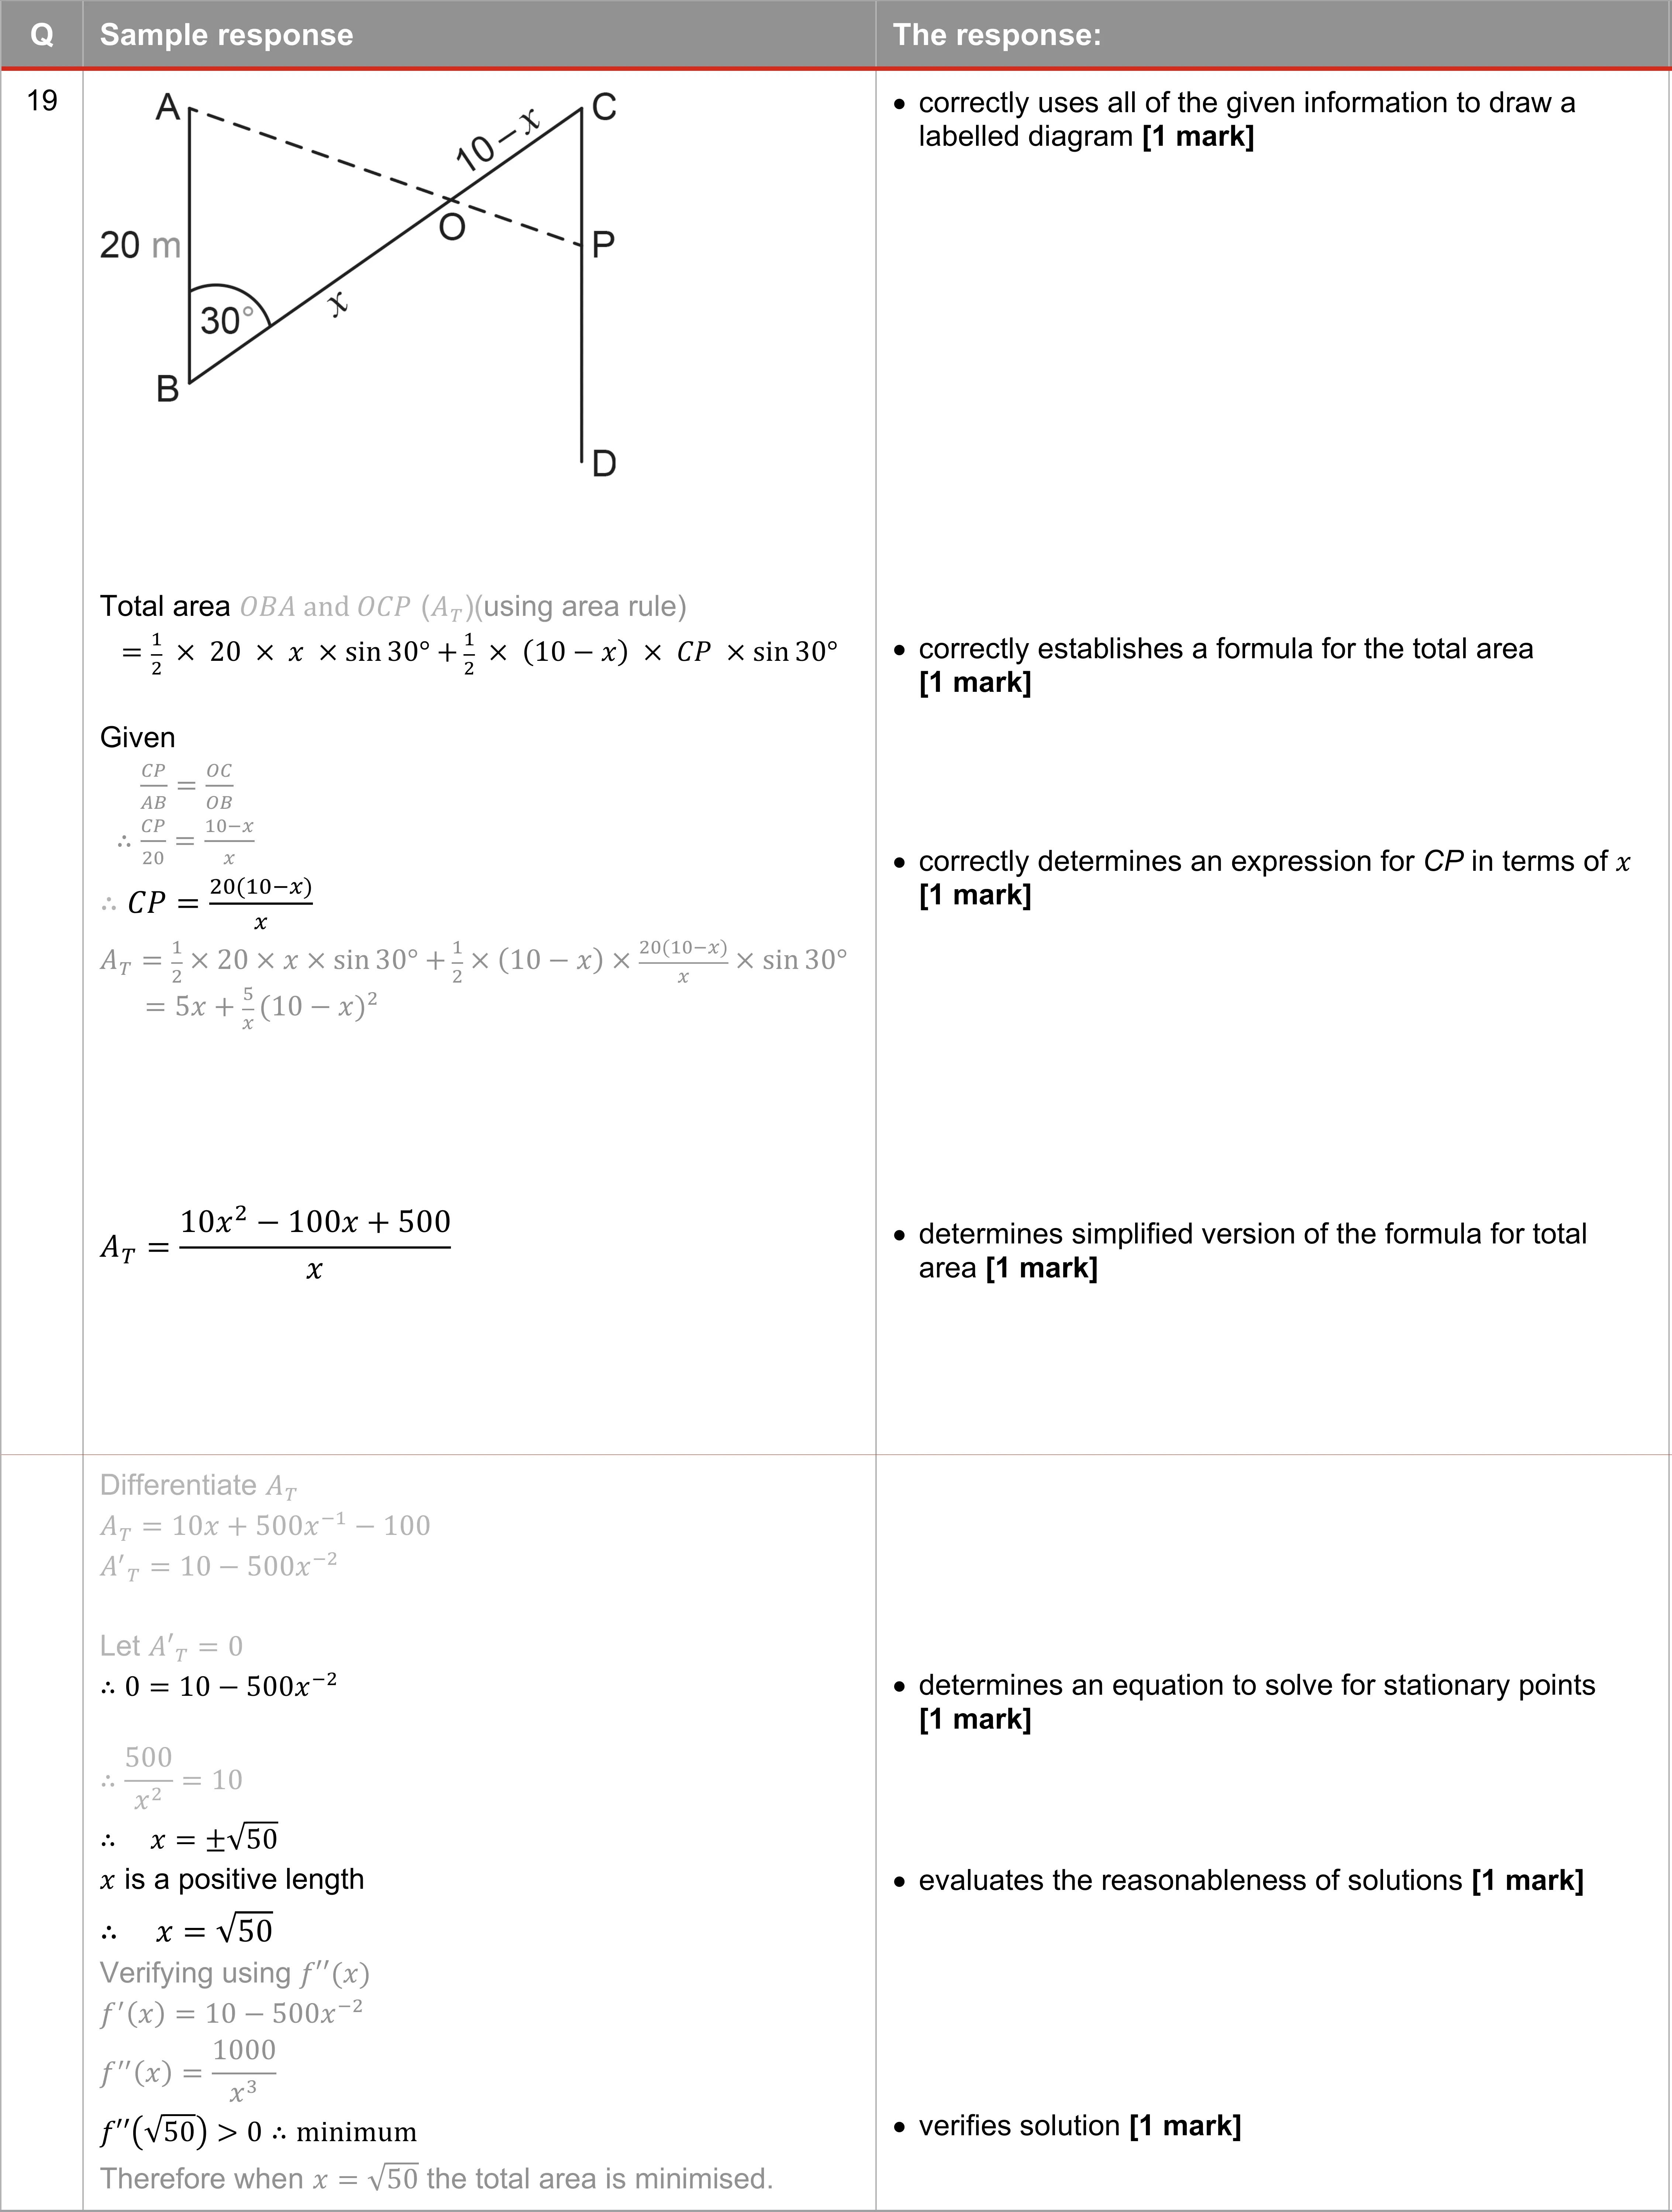
QUESTION 19 (7 marks) Two triangles are said to be similar if their corresponding angles are congruent and the corresponding sides are in proportion e.g. if AUV W is similar to AXYZ then ur _yw _uw LU=4X 2V =LY and LW = £Z and — =— XY YZ XZ Two parallel walls AB and CD where the northern ends are 4 and C respectively are joined by a fence from B to C. The wall AB is 20 metres long the angle ABC = 30° and the fence BC is 10 metres long. A new fence is being built from A4 to a point P somewhere along CD. The new fence 4P will cross the original fence BC at O. Let OB = x metres where 0 < x <10. Determine the value of x that minimises the total area enclosed by AOBA and AOCP. Verify that this total area is a minimum.
QUESTION 1 The position (in cm) of a particle is given by x = cos(4t) where ¢ 1s time (in seconds). The velocity of the particle when ¢ =5 is (A) 1.6323 cms ! (B) 0.4081 cm s (C) —0.9129 cms ™ (D) —3.6518cms !
QUESTION 2 Identify the correct features of the function f(x)= x (A) f`(-1)=0 f (-1)<0 B f(=1)=0/(-1)> ©) f`(-1)<0 f (-1)<0 (-1)<0 ./ (-1) (D) f 1)>0 1 1)> 1)<0
QUESTION 3 The derivative of the function f`(x) is given by f”(x) = sin(x3 ) for the domain —1.8 < x <1.8. The number of points of inflection that the graph of f (x) has on this interval is (A) 1 (B) 3 €) 4 (D) 5
QUESTION 4 The distribution for a sample proportion p has a mean of 0.15 and a standard deviation of 0.0345. The sample size is (A) 10 (B) 14 (C) 107 (D) 116
QUESTION 5 The continuous random variable X has the probability density function cos(x) —rx T 48 < & f(x)={ 2 > 2772 0o otherwise The standard deviation of X is (A) 0.467 (B) 0.684 (C) 1.211 (D) 1.467
QUESTION 6 A stall at the school fete sells cups of lemonade. Assuming the amount of lemonade in a cup 1s normally distributed with a mean of 60 mL and a standard deviation of 3 mL 80% of the cups contain more than (A) 52.4mL (B) 57.5mL (C) 61.6mL (D) 62.5mL
QUESTION 7 A marble moves in one direction in a straight line with velocity v = 21n(t + 1) (in metres per second) where 7 is time (in seconds) since the marble passed through the origin. Determine the distance from the origin the marble has rolled after 4 seconds. (A) 040 m (B) 1.60m (C) 322m (D) 8.09 m
QUESTION 8 Determine the equation of the asymptote of the function f (x) =logg (x — 3) —4. (A) x=-4 (B) x=-3 (C) x=3 (D) x=4
QUESTION 9 Determine the length of side AB in triangle ABC. A Not to scale (A) 22.13 (B) 14.44 (C) 9.97 (D) 7.82 @ 12
QUESTION 10 The solution of 2 = 42 is (A) (B) ©) (D) 1.48 231 3.37 4.54
QUESTION 11 (7 marks) A salesperson has a 20% probability of making a sale to each customer who enters the store. Each sale is independent of all other sales. a) Determine the mean number of sales on a day where 25 customers enter the store. [2 marks] b) Determine the standard deviation of the number of sales on a day where 25 customers enter the store. [2 marks] c) Determine the minimum number of customers who would have to enter the store to have an 88% chance or more of making at least one sale. [3 marks]
QUESTION 12 (4 marks) Suppose that the distance travelled by vehicles in a year can be modelled by a normal distribution. In 2021 vehicles travelled a mean of 13 700 km with a standard deviation of 3400 km. a) Determine the probability that a vehicle chosen at random travelled less than 12 000 km in 2021. [2 marks] b) Determine the value of x where 60% of vehicles travelled less than x km in 2021. [2 marks]
QUESTION 13 (4 marks) A sandy beach has a fence on one side and ocean on the other. The width of the beach is the distance (in metres) from the fence to the water`s edge. The width w(t) at a certain point is given by w(t) =a +bsin(£t —zj 0<r<24 6 3 where ¢ is time (in hours) since 6 am. The width of the beach is 8 metres at 8 am and 3 metres at 5 pm. a) Determine a and b. [2 marks] b) Determine the rate of change of the width of the beach at 8 am and the first time after this when this rate of change is repeated. [2 marks]
QUESTION 14 (8 marks) Ravi randomly sampled 200 different pet owners in Brisbane and found that 50 celebrate their pet`s birthday. a) Determine an approximate 95% confidence interval for the proportion of Brisbane pet owners who celebrate their pet`s birthday. [2 marks] Two of Ravi`s friends also randomly sampled Brisbane pet owners. The results are shown in the table. Friend`s name | Number sampled | Number who celebrate their pet`s birthday Khadija suggested a more precise estimate for the proportion of Brisbane pet owners who celebrate their pet`s birthday could be obtained by combining their results. b) Using all available data determine an approximate 95% confidence interval for the proportion of Brisbane pet owners who celebrate their pet`s birthday. [2 marks] c) Use the results from Questions 14a) and 14b) to evaluate the reasonableness of Khadija`s suggestion. [2 marks] The proportion of all Brisbane pet owners who celebrate their pet`s birthday is 0.24. d) Using the normal approximation determine the probability that in a randomly selected sample of size 200 more than 30% of pet owners celebrate their pet`s birthday. [2 marks]
QUESTION 15 (7 marks) A hiker begins her journey at a youth hostel (/) and walks for 8 km on a bearing of 052°T to her lunch stop (L). She then walks on a bearing of 210°T for 5.2 km until she reaches a campsite (C). Determine the direction she would need to walk in a straight line to return directly to the youth hostel.
QUESTION 16 (4 marks) The time spent waiting in a queue at a certain supermarket is given by (X +1 1) minutes where X is a random variable with the probability density function al4-x* /()= (T) 0 otherwise —2€x£2 Determine the probability of waiting between 10 and 12 minutes in a queue at this supermarket.
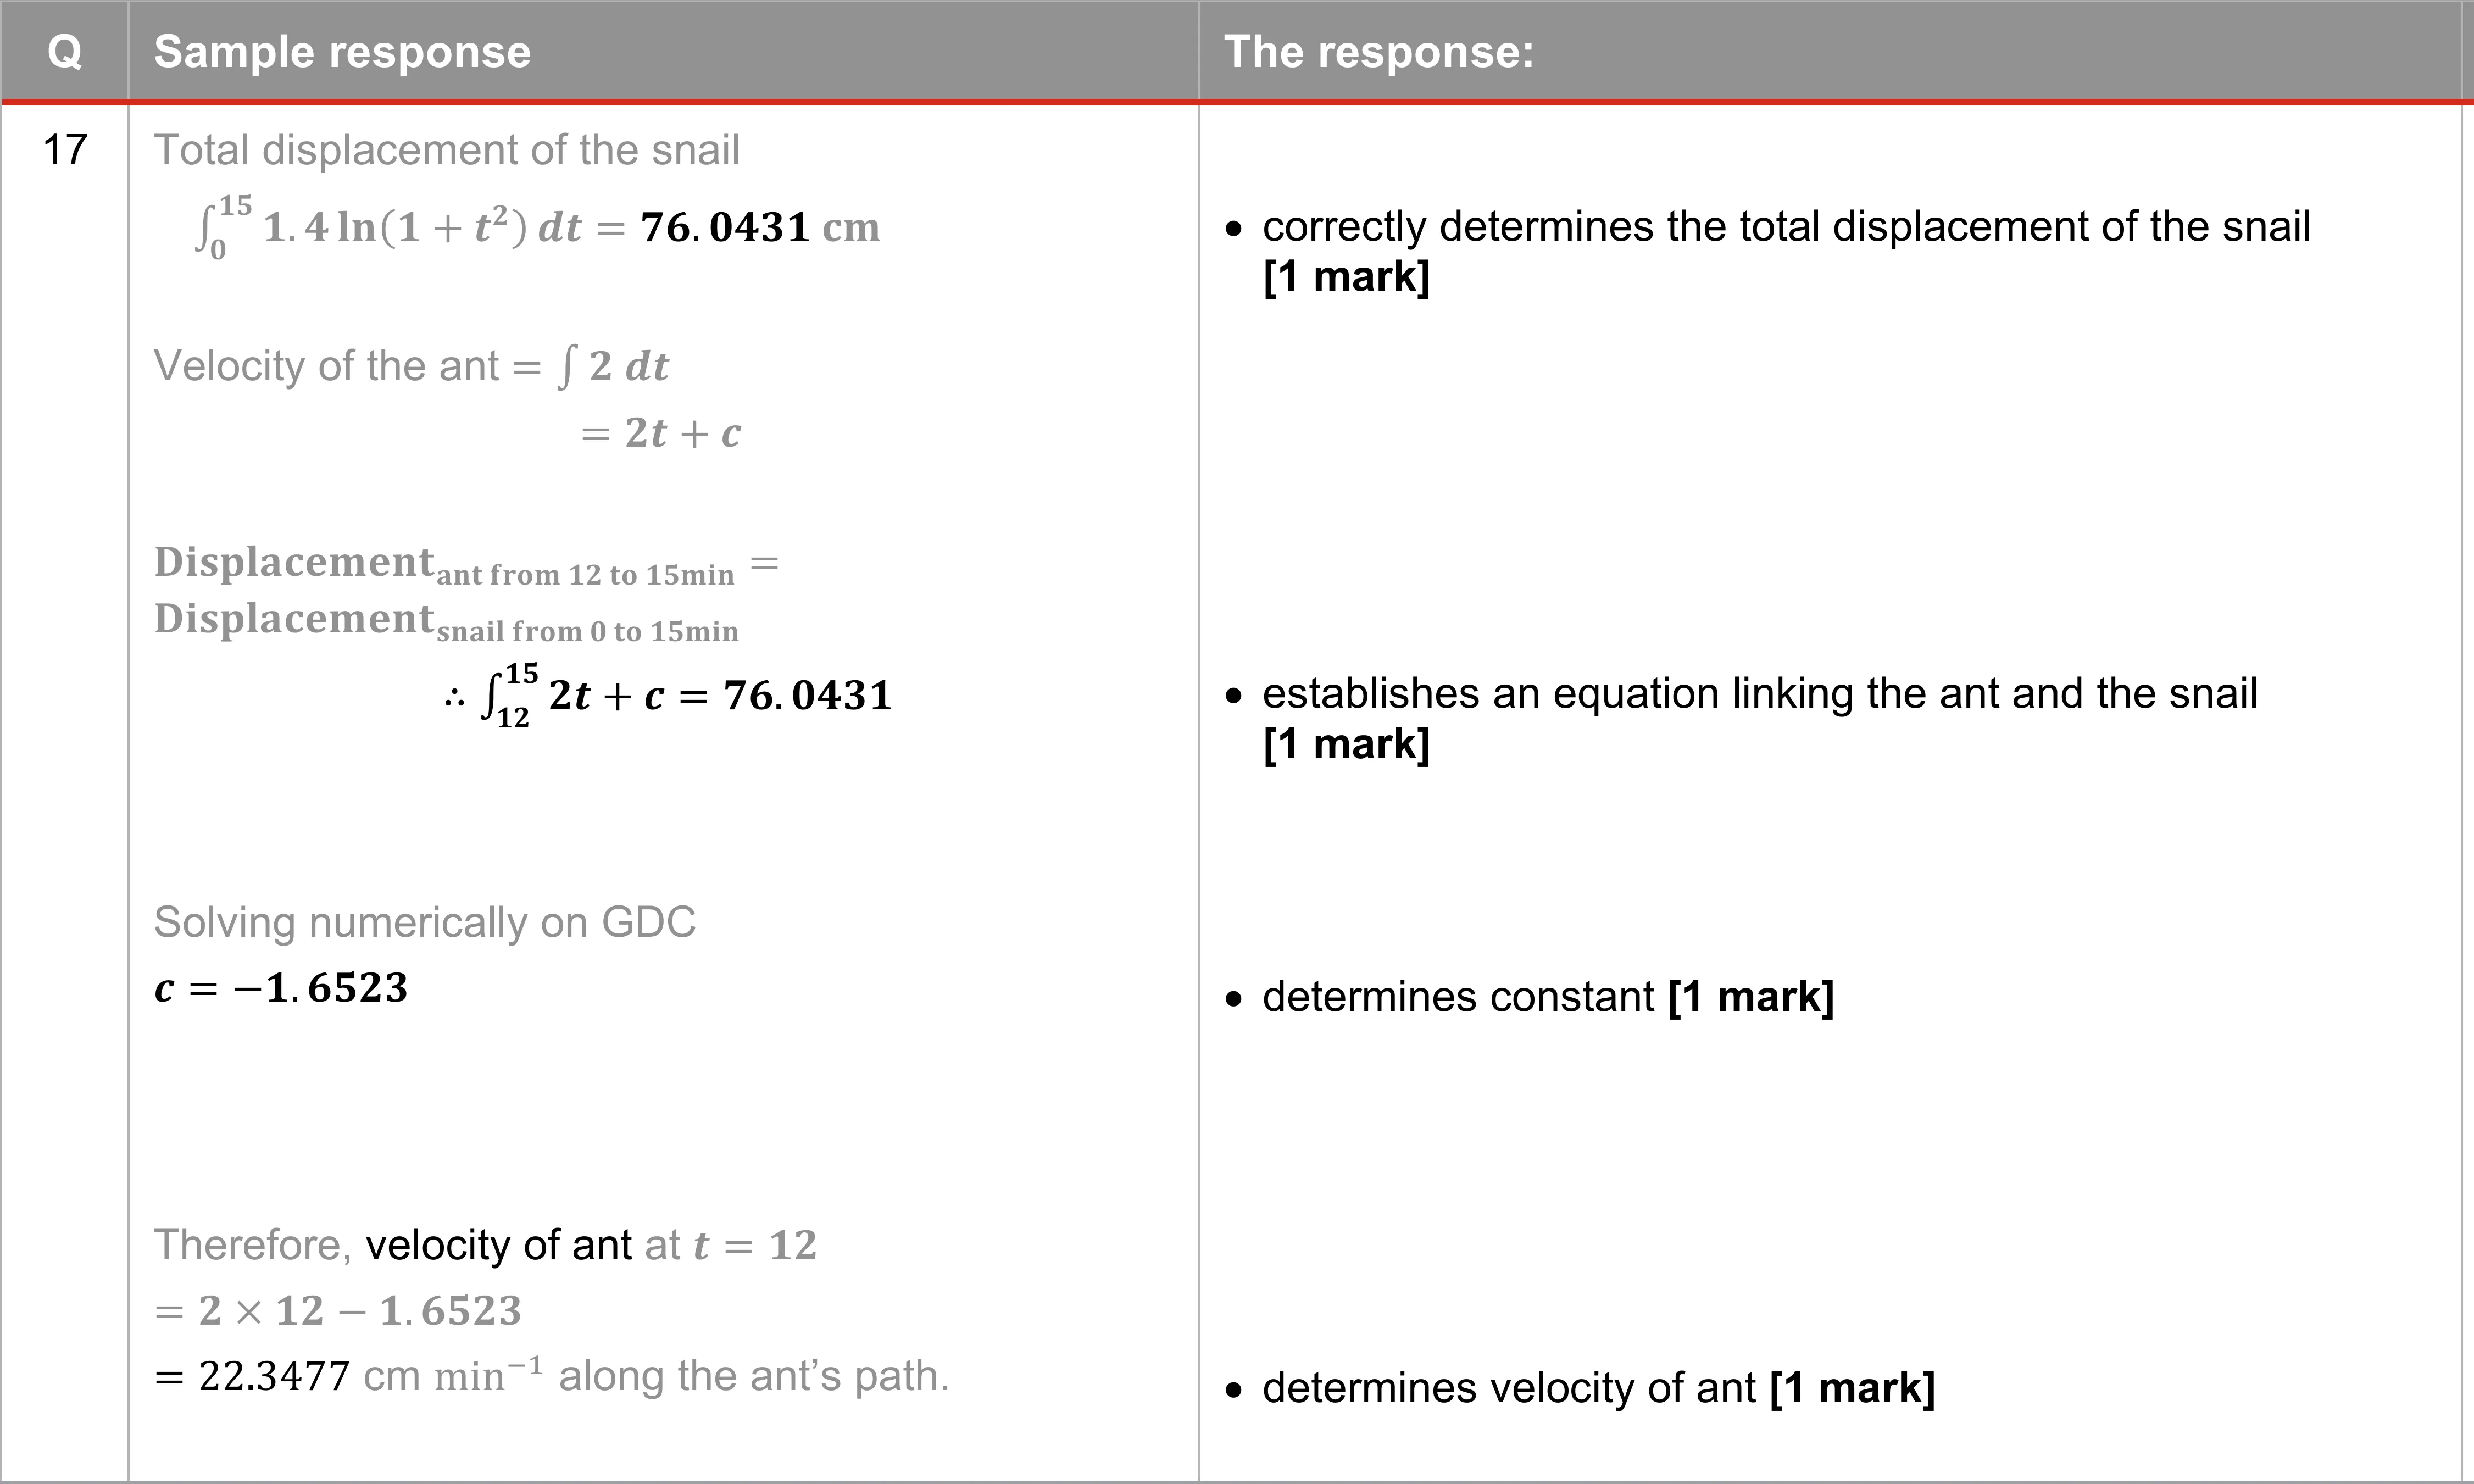
QUESTION 17 (4 marks) A snail is travelling along a straight path from point 4. The snail`s velocity (cm min ) is modelled by v(t)= 1.4ln(1 e ) where ¢ is time (in minutes) for 0 <z <15. An ant passes point 4 12 minutes after the snail and follows the snail`s path. The ant moves with a constant acceleration of 2 cm min~2 and passes the snail at # =15 minutes. Determine the ant`s velocity at point A4.
QUESTION 18 (3 marks) The intelligence quotient (IQ) of individuals in a population is normally distributed with a mean of 100 and a standard deviation of 16. Nine individuals are chosen at random from the population. Determine the probability that no more than two of the individuals have an 1Q of at least 120.
QUESTION 19 (4 marks) Flying foxes enter and leave a fruit-growing region every evening. The rate at which the flying foxes enter the region is modelled by the function A(t)= 42sin[0.03t —%) +71 0<1<240 The rate at which the flying foxes leave the region is modelled by the function L(t)= 42sin(0.04t —gj +42 0<1<240 Both A(¢) and L(¢) are measured in animals per minute and ¢ is measured in minutes after 7 pm. There are 100 flying foxes in the region at 7 pm. Determine the maximum number of flying foxes in the region and the time that this occurs.
QUESTION 1 The random variable X is binomially distributed with 10 trials and a probability of success equal to 0.25 at each attempt. The value of P(X = 1) is equal to @ () ® () © 1-() ™ 1-()
QUESTION 2 The approximate area under the curve y = 2x? between x = 1 and x = 4 is found using rectangles (of width equal to one unit) as shown in the diagram. -1 0 1 2 3 4 5 What is the approximate area found using these rectangles? (A) 58 units` (B) 45 units` (C) 42 units® (D) 28 units?
QUESTION 3 If y = cos?(3x) then Z—i` = (A) —65sin(3x) cos(3x) (B) —2sin(3x) cos(3x) (C) 2 sin(3x) cos(3x) (D) 6 sin(3x) cos(3x)
QUESTION 4 0 3 ; . i If [ f(x)dx = 4 and [ f(x)dx = —10 which of the following is true? (A [3 fC)dx = —14 B) [° fe)dx =6 © [P fx)dx=6 D) [ f(x)dx =14
QUESTION 5 The slope of the tangent to the graph of y = In(x?) atx = e? is 1 (A) 2 2 (B) 2 4 ©) i 1 (D) —
QUESTION 6 7 dx Calculate f_ 1 TG0 (A 1 4 B) 3 € 2 (D) 4
QUESTION 7 The distribution of marks in three subjects is given below. The mark received by a student in each of the subjects is also shown. Science 60 15 70 Mathematics 68 6 72 Music 65 9 72 Standardised z-scores were used to compare the results and showed that the student (A) performed equally well in mathematics and science. (B) performed equally well in mathematics and music. (C) performed better in mathematics than in science. (D) performed better in mathematics than in music.
QUESTION 8 Given y = 5e2* rearrange the function to make x the subject. (A) x=In (%) ®) x=j@ (€) x=In(V5y) D) x=In ((%)Z>
QUESTION 9 An equilateral triangle has side lengths of 9 m. The area of the triangle is (A) —m ® Ll © LB D) =`
QUESTION 10 If the sample size is decreased but the sample proportion and the confidence level remain the same the width of the confidence interval (A) will increase. (B) will decrease. (C) remains unchanged. (D) may increase or decrease.
QUESTION 11 (5 marks) Determine: 4 3In(5x) 2) <= 3In(5Y) d b) — (x3cos(x* + 1)) dx c) [3e*dx [1 mark] (You do not need to simplify.) /3 marks] [1 mark]
QUESTION 12 (3 marks) Simplify the following: a) logg9 + 2logg 2 logz 16 b) log; 64 [1 mark] [2 marks]
QUESTION 13 (4 marks) Solve the following: a) logs(2x+4) =2 [2 marks] b) In(7 —x) —In10 = In(x) [2 marks]
QUESTION 14 (5 marks) 1 Letv(t) = = + 3sin(t) t = 0 represent the velocity of an object moving in a straight line. T Att = 3` the position of the object is 4. a) Determine the acceleration function. [2 marks] b) Determine the displacement function. [3 marks]
QUESTION 16 (5 marks) Determine the equation of the tangent to the function y = x3 + ax? + bx + 1 at the point of inflection (1 6).
QUESTION 17 (7 marks) A continuous random variable X has a probability density function f defined by: _(a+bx?*? 0<x<1 ! (x)—{ 0 otherwise 3 i IfE(X) = = determine a and b.
QUESTION 18 (6 marks) Determine the area of the largest rectangle that has one side on the x-axis and two vertices on the curve y=e™”* B Express your answer in simplest form. The curve is sketched below. Not drawn to scale
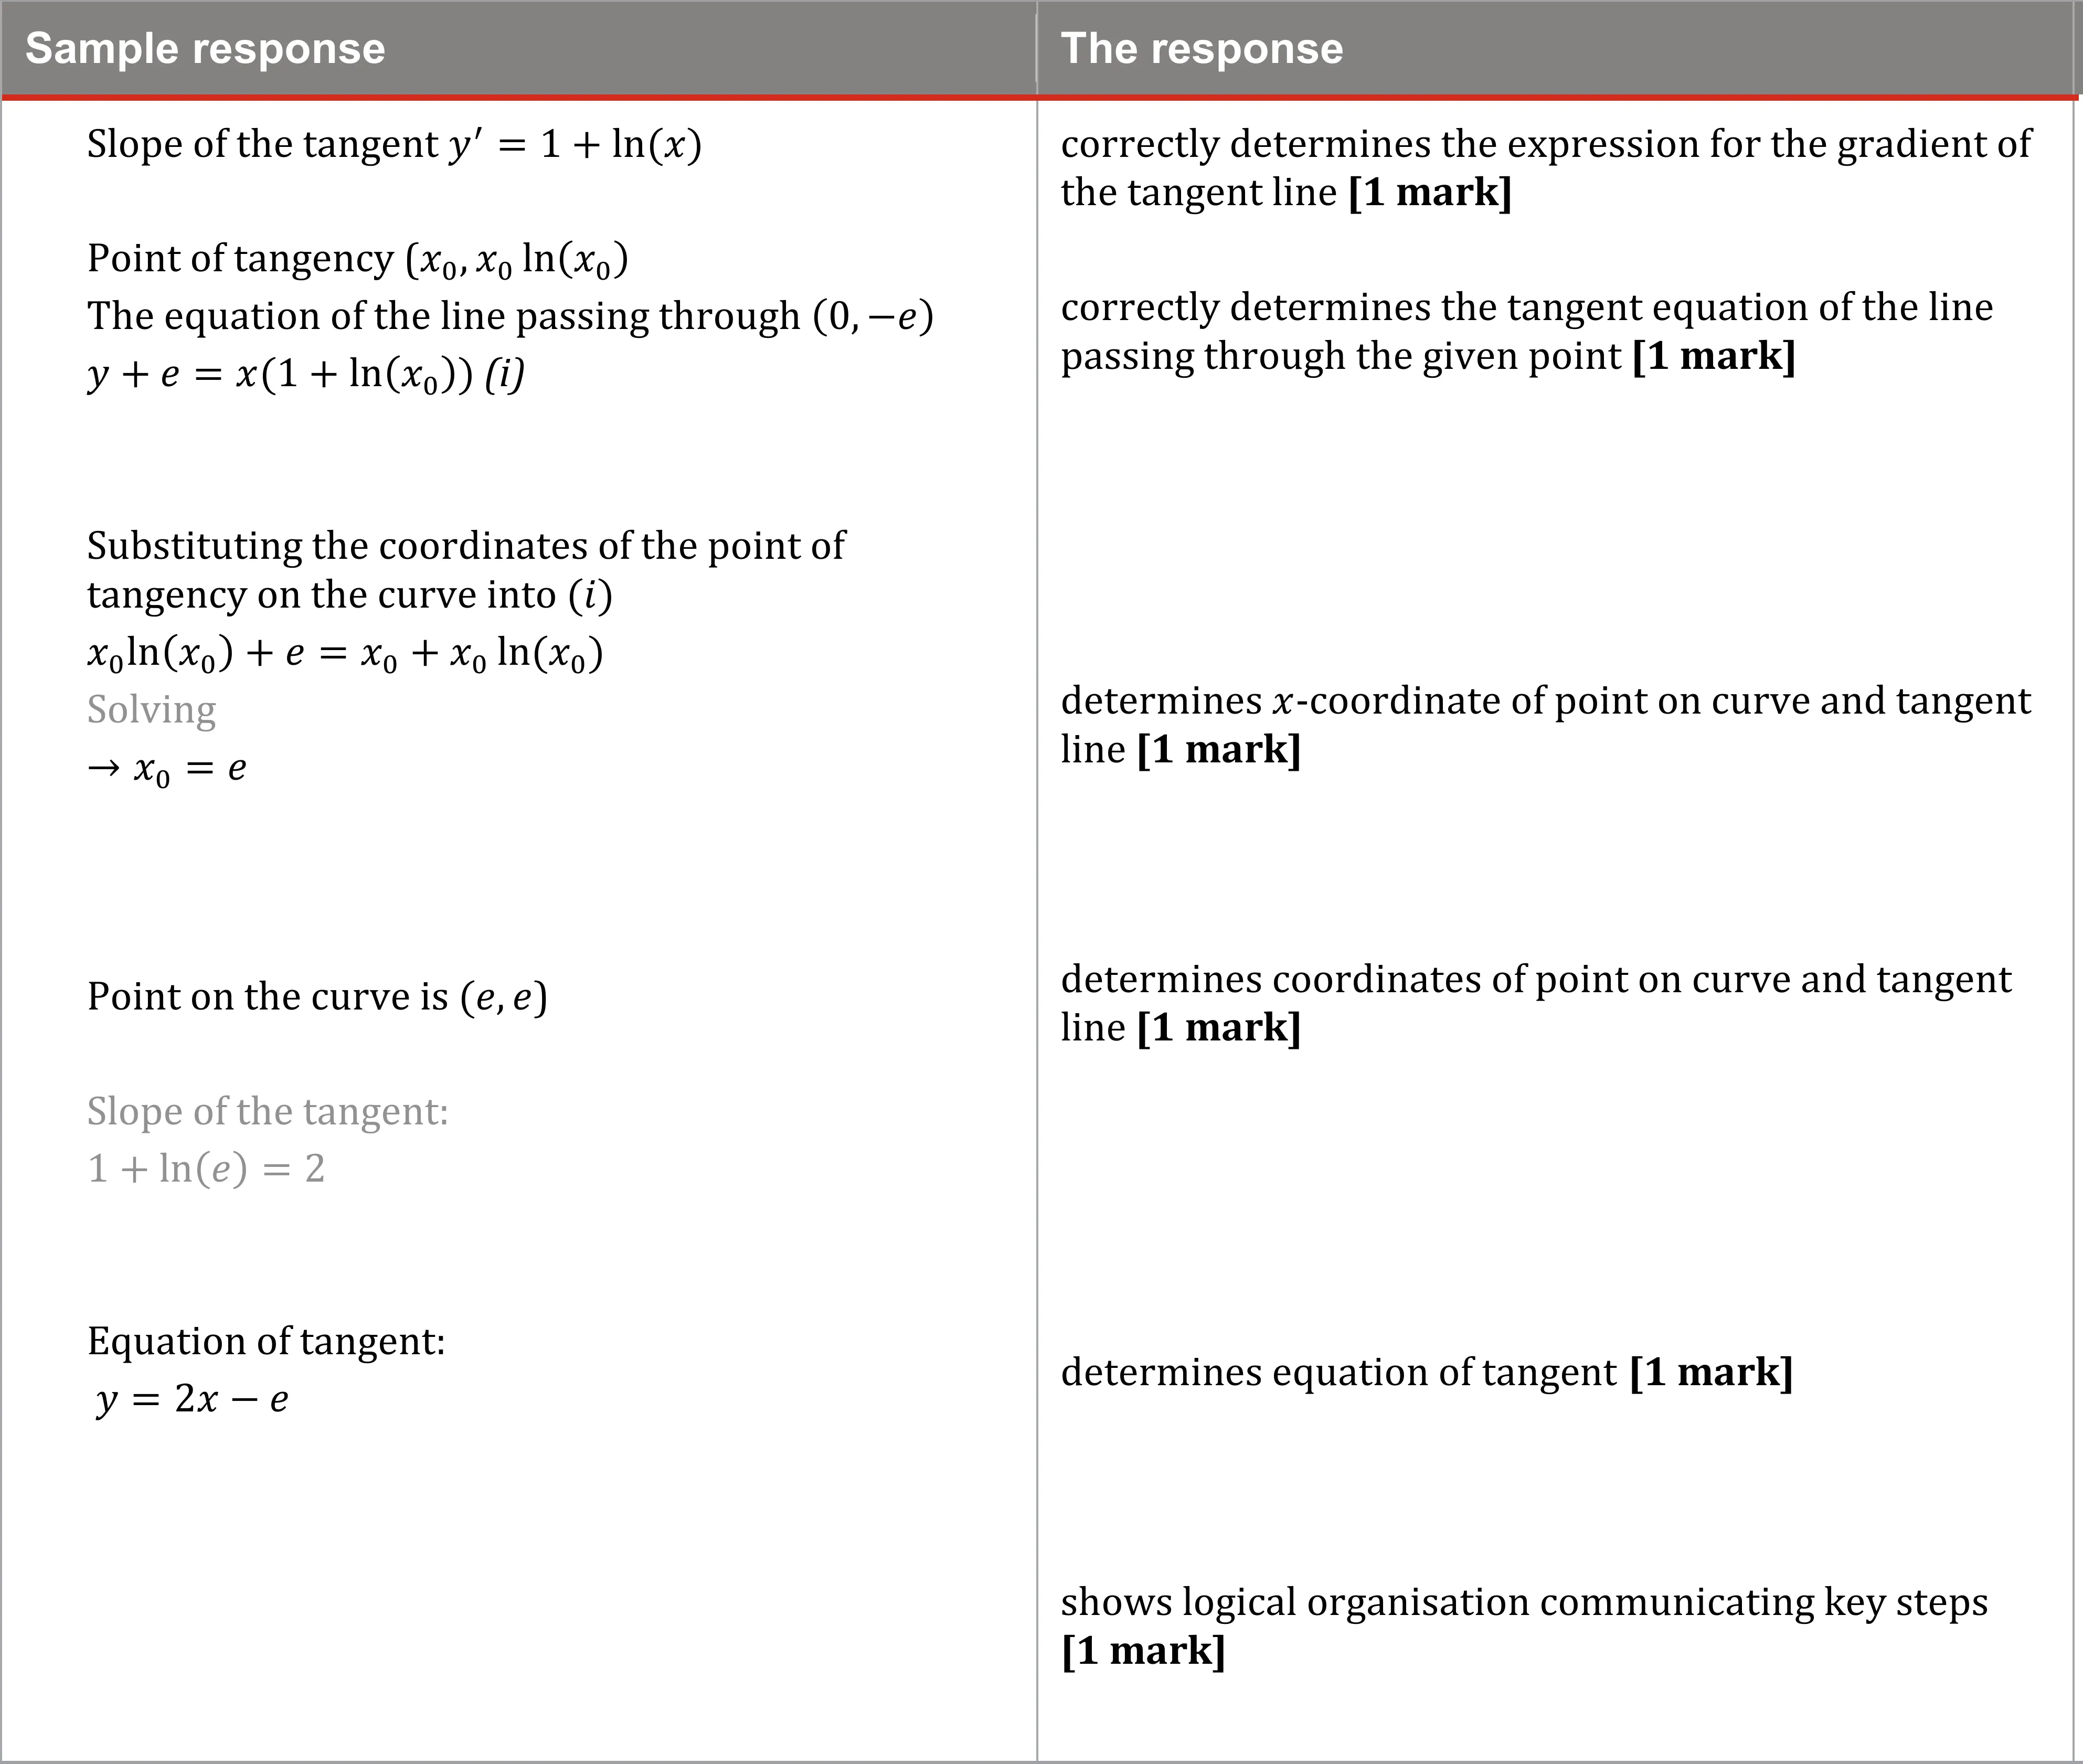
QUESTION 19 (6 marks) Determine the equation of the tangent to the curve y = x In(x) that passes through the point (0 —e).
QUESTION 15 (9 marks) Consider the function: f(x) = x2e(=**4) The first and second derivatives are: f`(x) = x(2 — x)eC*+® f(x) = (2% — 4x + 2)e¥* The graphs of f(x) f`(x) and f (x) are shown below: Not drawn to scale f(x) f(x) f(x) a) Determine the coordinates of the local maximum of f(x). [2 marks] b) Use the second derivative test to verify the nature of the stationary point from 15a). [2 marks] c) Determine the x-coordinates of any point/s of inflection. [2 marks] d) Determine the intervals where f (x) is concave up and concave down. [3 marks]
QUESTION 1 Determine the asymptote of the graph of the function f(x) = log;(x +5) (A) x=-5 (B) x=5 ©) y=-5 D) y=5
QUESTION 2 A population of bacteria after t hours is given by P(t) = 5000e°%18¢ The rate of increase of the population (to the nearest unit) at 15 minutes is (A) 74 399 bacteria/hour. (B) 13 392 bacteria/hour. (C) 5230 bacteria/hour. (D) 941 bacteria/hour.
QUESTION 3 Using the trapezoidal rule with four sections the approximate area under the curve y = x? + 5 between x = 0 and x = 2 is (A) 12.67 units® (B) 12.75 units® (C) 13.00 units? (D) 13.75 units?
QUESTION 4 The area of the region enclosed by the graphs of y = xvVx + 1 and y = 2x 1s (A) 1.267 units® (B) 0.467 units® (C) 0.200 units` (D) 0.029 units®
QUESTION 5 Two particles move along the x-axis. For 0 < t < 5 their respective position functions are given by: x ; = sin(2t) and x = e~ For how many values of t do the particles have the same position? A) 4 B) 3 €) 1 (D) 0
QUESTION 6 The side lengths of a triangle are in the ratio 2:3:4. The smallest angle in this triangle is (A) 0.51° (B) 0.81° (C) 28.96° (D) 46.57°
QUESTION 7 The graph of y = x> — 6x? is concave downwards when (A) x < —2 B) x<0 < x<?2 (D) x <4
QUESTION 8 A particle travels along a straight line with a velocity of v(t) = 3e(_7t) X sin(2t) ms™. Determine the acceleration of the particle at t = 2 seconds. (A) —1.03ms™? (B) —0.01 ms™? (C) 2.49ms? (D) 3.51ms~?
QUESTION 9 The birth mass of babies is normally distributed with a mean 3500 grams and a standard deviation 500 grams. The probability that the birth mass of a baby is less than 3200 grams is (A) 0.01 (B) 0.06 (C) 0.22 (D) 0.27
QUESTION 10 A survey found that 142 out of 200 people aged 30 to 39 have some form of tertiary qualification. The approximate 95% confidence interval for the proportion of people aged 30 to 39 who have some form of tertiary qualification for this survey is (A) (0.62 0.80) (B) (0.63 0.79) (C) (0.65 0.77) (D) (0.66 0.76)
QUESTION 11 (4 marks) The Palermo Technical Impact Hazard Scale (P) is a logarithmic scale used by astronomers to rate the potential hazard of a Near-Earth Object (NEO). Potential impacts with positive Palermo Scale values will generally indicate situations that merit some level of concern. For the NEO asteroid Apophis P is given by: P = logso (8.71 Zi10—6) where p; represents the impact probability. a) Determine P for a p; value of 1 in 100 000. [1 mark] John believes that increasing the P value in 11a) by 2 will make the chance of impact 1000 times more likely. b) Evaluate the reasonableness of this statement. [3 marks]
QUESTION 12 (5 marks) People with type O negative blood are said to be ‘universal donors`. In Australia 9% of the population has this blood type. On a given day a random group of 45 people volunteer to donate blood. a) Identify why this context is suitable for modelling as a binomial distribution. [1 mark] b) Determine the mean and standard deviation of the number of people who are universal donors. [2 marks] c) Determine the probability that no more than 3 of the donors are universal donors. [2 marks]
QUESTION 13 (6 marks) 1 11643t [2 marks] —3 Let N(t) = [ 1800t(16 + 3t2)=2 dt a) Determine Z—A: it M(t) = b) Using the result from 13a) determine N (t) [1 mark] ¢) Determine N`(4) [1 mark] The function N (t) models the total number of customers N served by staff after ¢t hours during an 8-hour workday (0 <t < 8). At time t = 0 no customers had been served. d) Determine N(4) [2 marks]
QUESTION 14 (5 marks) Solve for the two possible triangles using the information below: A=25°%a=12and c = 27
QUESTION 15 (8 marks) Suppose the proportion of Australians who supported the removal of single-use plastic bags from supermarkets is 64%. a) Using the normal approximation determine the probability that in a randomly selected sample of size 100 more than 70% of those surveyed supported the removal of the single-use plastic bags. [2 marks] b) Determine the size of the sample required for the survey to achieve a margin of error of 4% 1in an approximate 95% confidence interval for this proportion. [2 marks] c) Identify the effect that halving the margin of error has on the sample size obtained in 15b). [2 marks] d) Determine the probability that in a randomly selected sample of size 25 the sample proportion is equal to the population proportion. [2 marks]
QUESTION 16 (4 marks) Radar station R picks up signals from two ships. Ship A is stationary and on a bearing 041°T from R and is 65 kilometres away. Ship B is on a bearing 295°T from R and is 53 kilometres away. Determine the time (in hours) for ship B to travel to ship A if ship B can travel at 30 kilometres per hour.
QUESTION 17 (3 marks) During one 30-day period the rate at which pollution passes into a nearby lake is measured every six days and results are given in the table below. Rate of pollution in units per day p(t) This information can be modelled as a quadratic function. Determine the total amount of pollution entering the lake during this 30-day period.
QUESTION 18 (5 marks) The amount of a certain drug in the bloodstream M (mg) at any time ¢t (hours) is modelled closely by M(t) = Ate™t where A and b are parameters. a) Determine the exact values of A and b if the maximum amount of the drug in the [3 marks] bloodstream was 120 mg at t = 2 hours. [2 marks] b) Evaluate the reasonableness of your solution.
QUESTION 19 (5 marks) Consider the following information when completing this question. If X is normally distributed with mean p and standard deviation o then X~N(u 0%) If X and Y are two independent random normal variables such that X~N(py 0 %) and Y~N (u 0 °) then X —Y~N(uy — phz 01° + 0 °) and X + Y `N(‘ul + flz 0-12 + 0-22) Contestant A and contestant B have trained to navigate an obstacle course. The times for each contestant to run the obstacle course are independent of each other. On any given day the time to run the obstacle course for each contestant is normally distributed. Let A be the run time (in minutes) for contestant A and B be the run time (in minutes) for contestant B with A~N(80 10%) B~N(78 122) Determine the probability that contestant B runs the obstacle course faster than contestant A.
QUESTION 20 (5 marks) A farmer has a paddock with straight fences on two sides (fence A and fence B) perpendicular to each other and bounded by a creek on the other side. Fence B is 4 kilometres long. The creek boundary can be modelled using d=In(5x+¢e)—1 where d is the perpendicular distance in kilometres from fence A to the creek and x is the distance in kilometres along fence A from the point O. The farmer wants to divide his paddock area in half with a straight fence parallel to fence B. Not drawn to scale creek Fence B O Fence A Determine where the farmer should locate the fence.
QUESTION 1 el (*) is equivalent to (A) 0 (B) 1 (C) x (D) —
QUESTION 2 If f(x)=e°** determine the value of / (2). (A) e? (B) 2e (C) -e? (D) —2e?
QUESTION 3 A bag contains 10 buttons of the same shape and size in different colours: 5 blue 3 green and 2 red. If 3 buttons are randomly drawn from the bag which probability can be calculated using the binomial distribution? (A) P(3 green) with replacement (B) P(3 blue) without replacement (C) P(2 green and | red) with replacement (D) P(2 red and | blue) without replacement
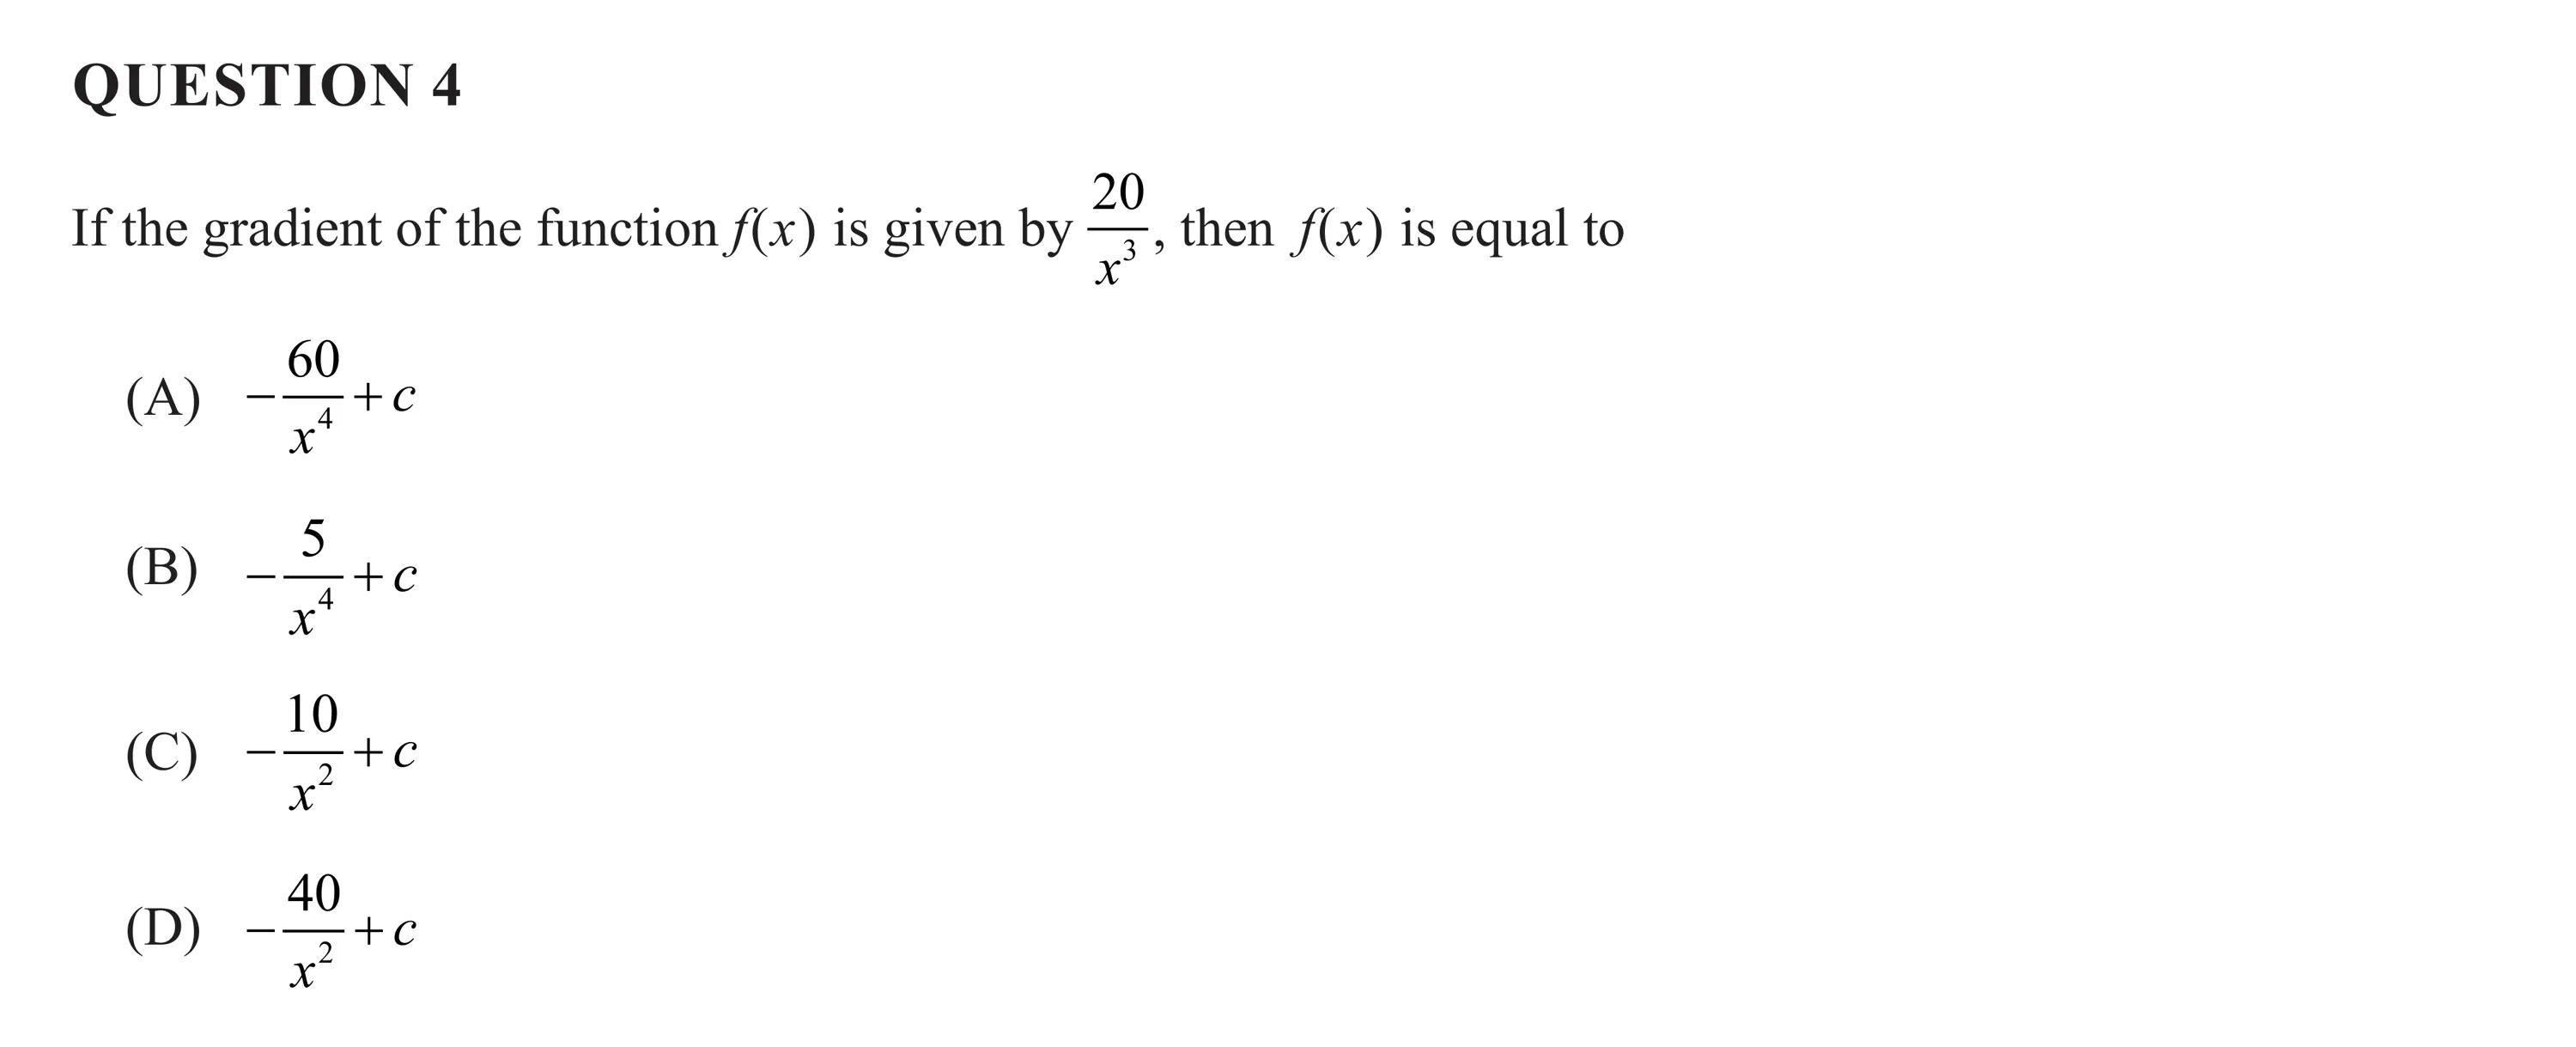
QUESTION 4 20 ; If the gradient of the function f(x) is given by — then f(x) is equal to x? 60 (A) —7+e xX (B) 2 +¢ Xx 10 (C) -y te X (D) he x
QUESTION 5 Determine } aI 1 2x (A) lin 2 (B) tins 2 1 1 D) =In3 (D) In
QUESTION 6 qa —1 Substitutions for / are used to estimate the limit of as h — 0. Which sequence is the most appropriate? (A) —4 -2 -1 -0.5 -0.25 -0.125 ... (B) -0.05 -0.1 -0.2 -0.4 -0.8 ... (C) 2 1 0 -1 -2 -3... (D) 1 2 3 4 5 6...
QUESTION 7 Determine the mean of the continuous random variable X with the probability density function 1 fO)=48 0 otherwise O<x<4 (A) (B) (C) (D) WloO wplRe WlWw CwleH
QUESTION 8 A sample of size n was used to estimate a population proportion. An approximate margin of error of 3% was calculated using z = 1.96. Given the sample proportion was 0.6 determine n. (is6) (A) n= sb2es 0.24 008) 1.96 (oe) 1.96 C) na woe ) n= Ty wo) na 24 0.03 J 1.96
QUESTION 9 Determine fj zsin Exax (A) 3 (B) 6 (Cc) -3 (D) -6
QUESTION 10 The continuous random variable Y has the probability density function l+y 0<y<¥ 3-1 f(y) = 0 otherwise ] Determine P(O< y< 5 (ay 1 5 (iB) 3 8 (Cc) > 8 3 D) = (D) 1
QUESTION 11 (4 marks) Two random samples (A and B) were obtained using two different Bernoulli experiments. Each Bernoulli trial in the random samples was recorded as 1 (for success) or 0 (for failure). The results are shown. In sample A for each trial the mean is 0.8 and the variance is 0.16. a) Use the sample B results to determine the mean and variance for each trial in sample B. = /2 marks/ b) Compare the variability about the means of samples A and B. [2 marks]
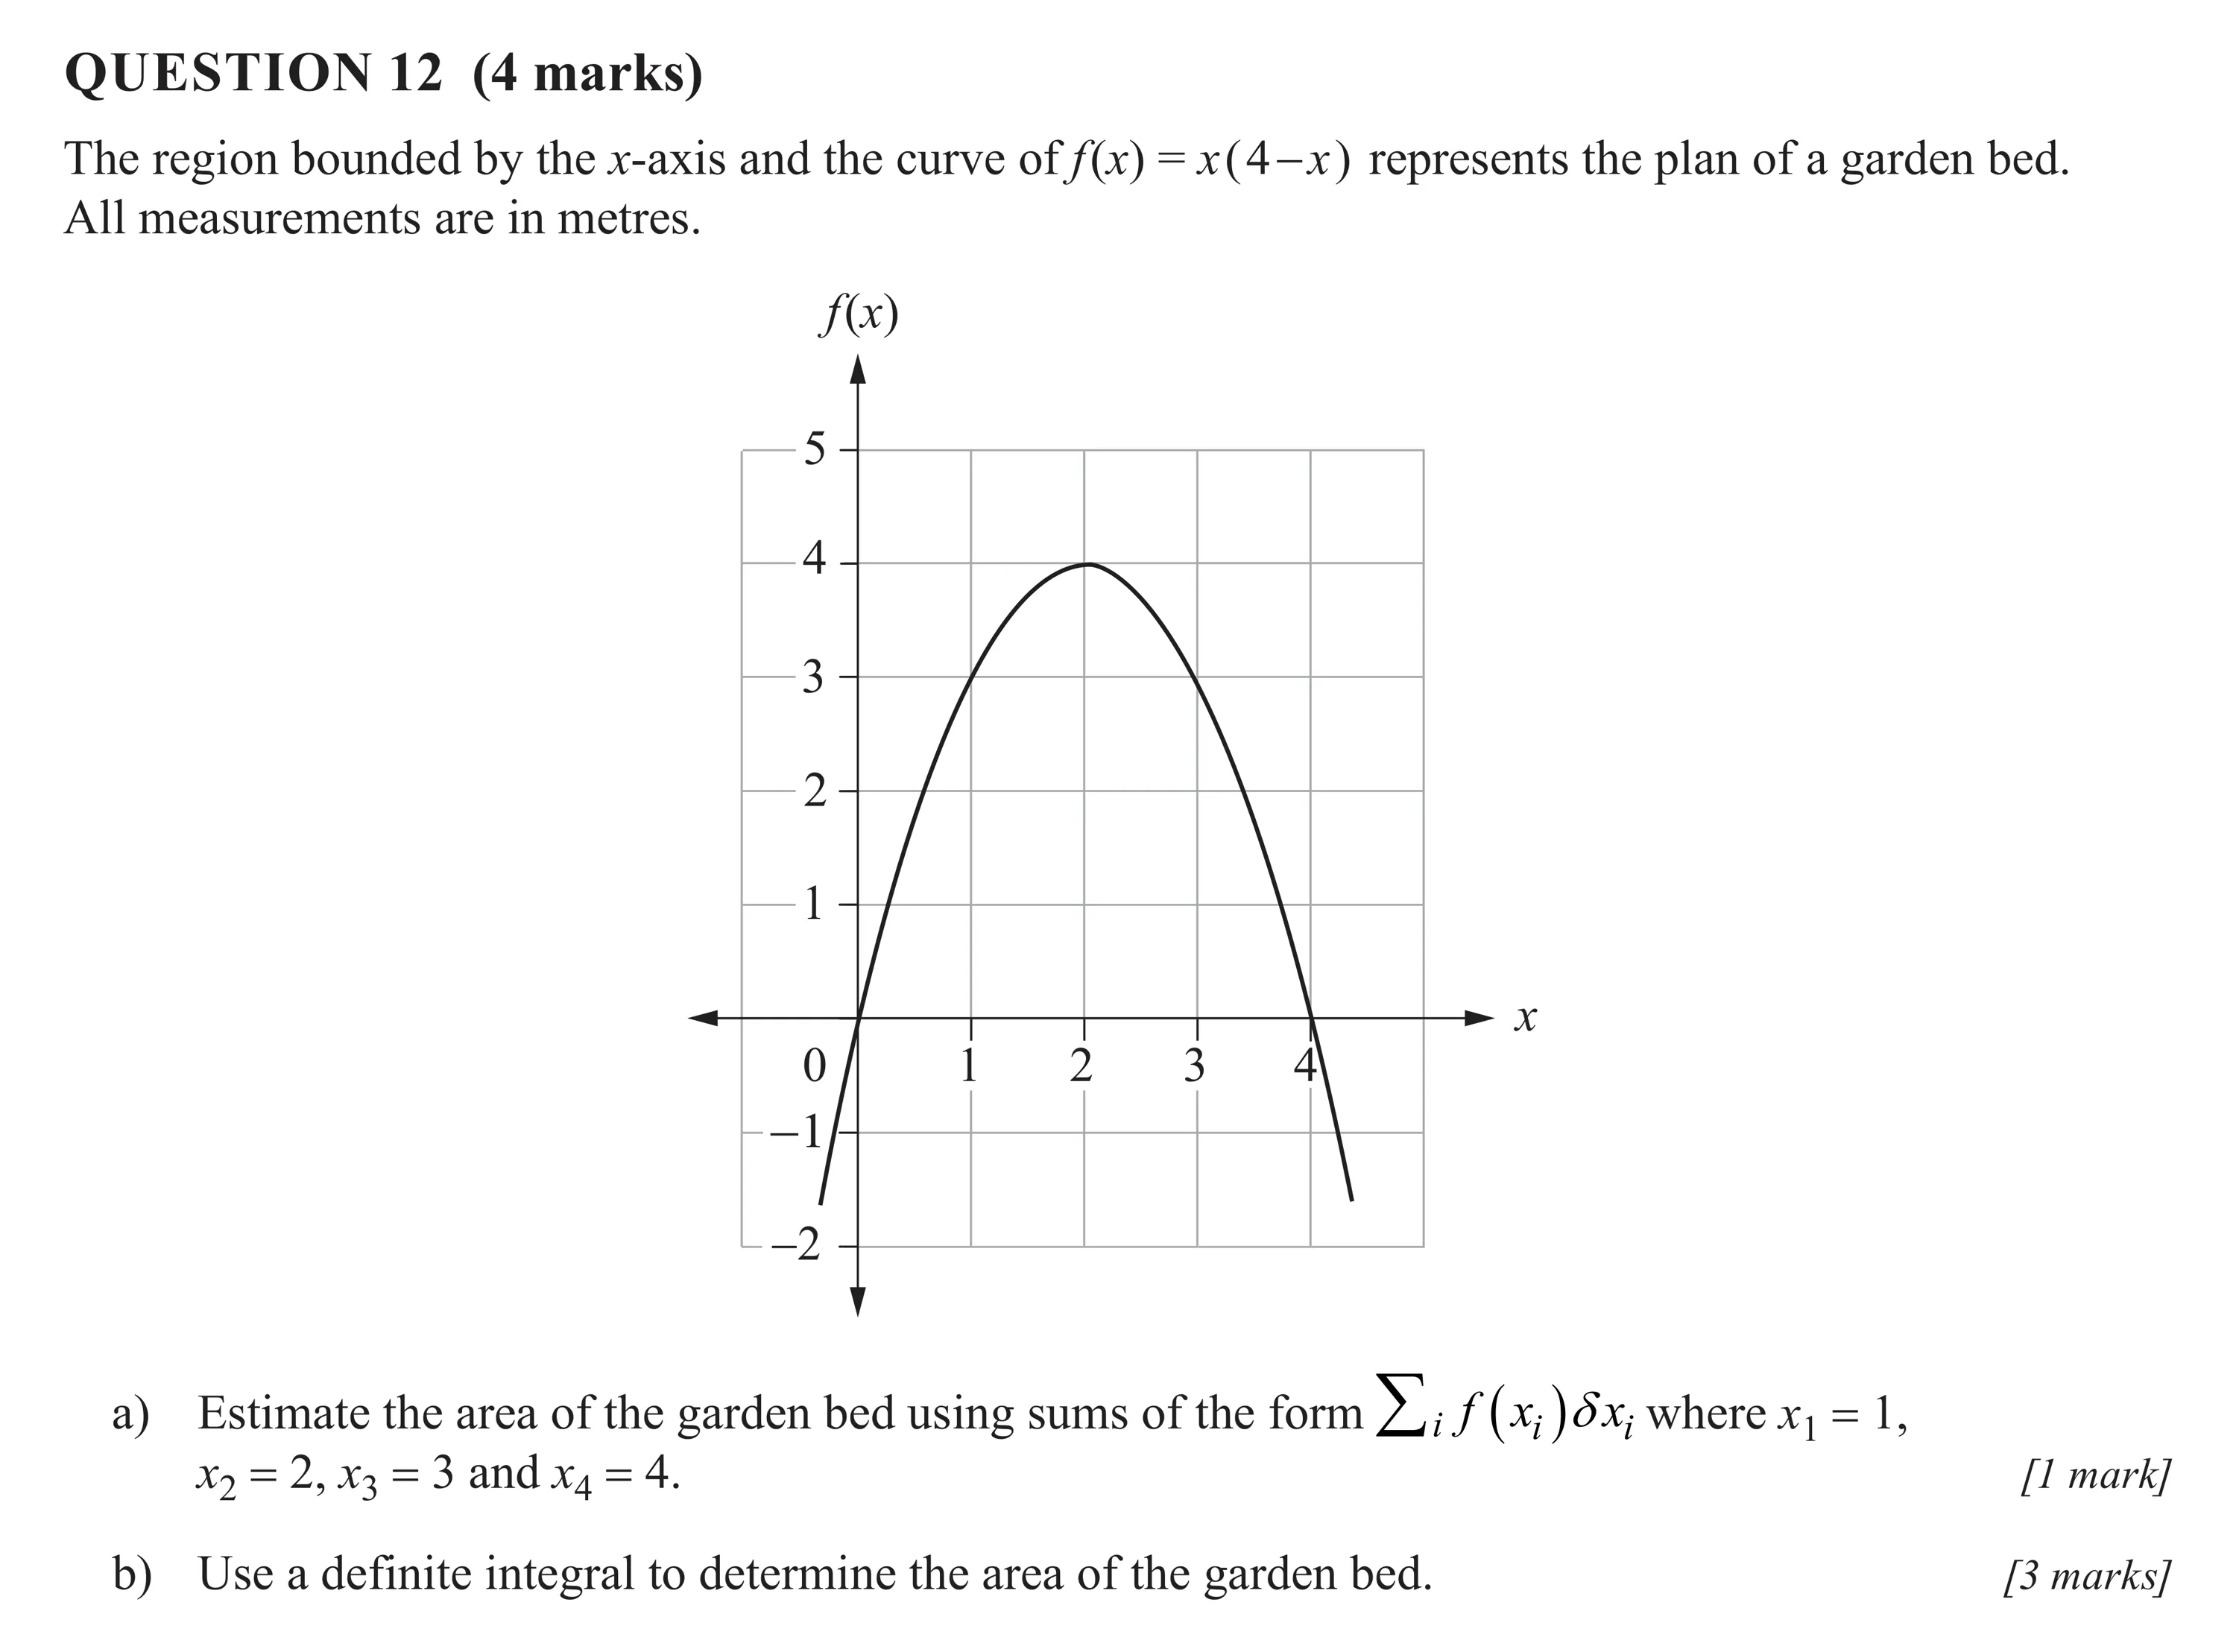
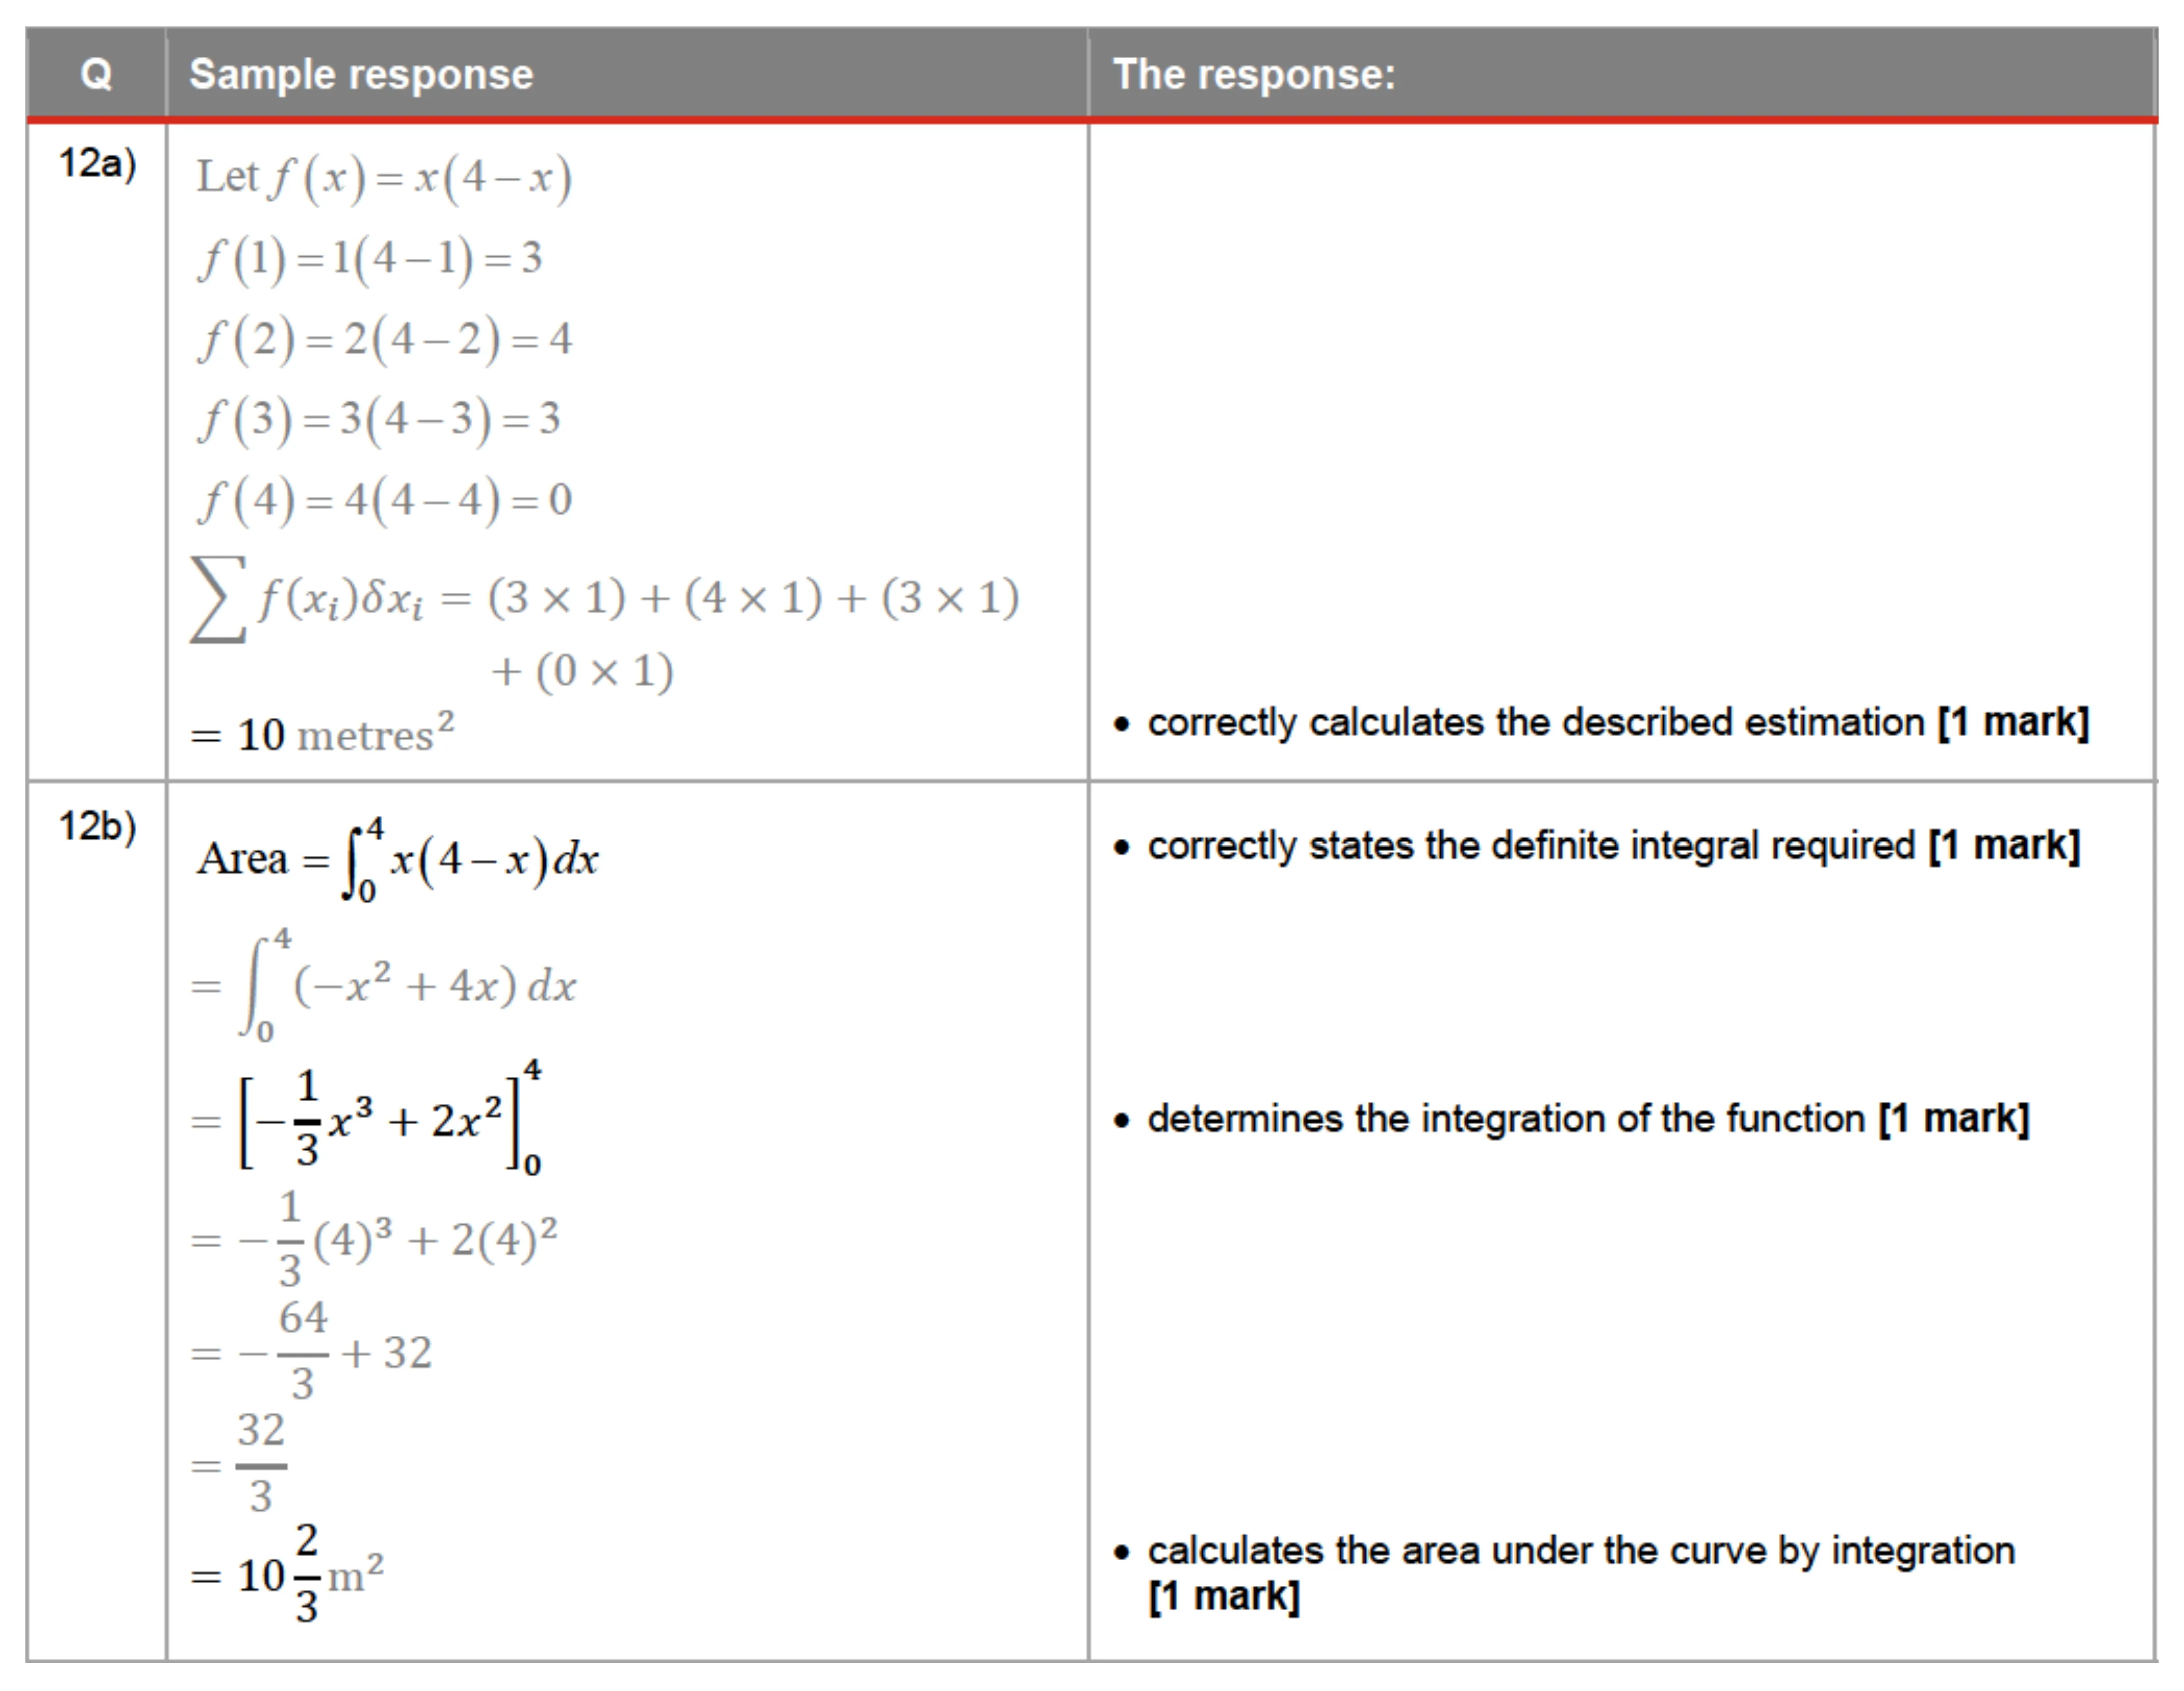
QUESTION 12 (4 marks) The region bounded by the x-axis and the curve of f(x) =x(4—x) represents the plan of a garden bed. All measurements are in metres. f(x) a) Estimate the area of the garden bed using sums of the form > f (x; )Ox; where x = 1 Xy = 2 x3=3 and x 4=4. [1 mark] b) Use a definite integral to determine the area of the garden bed. [3 marks]
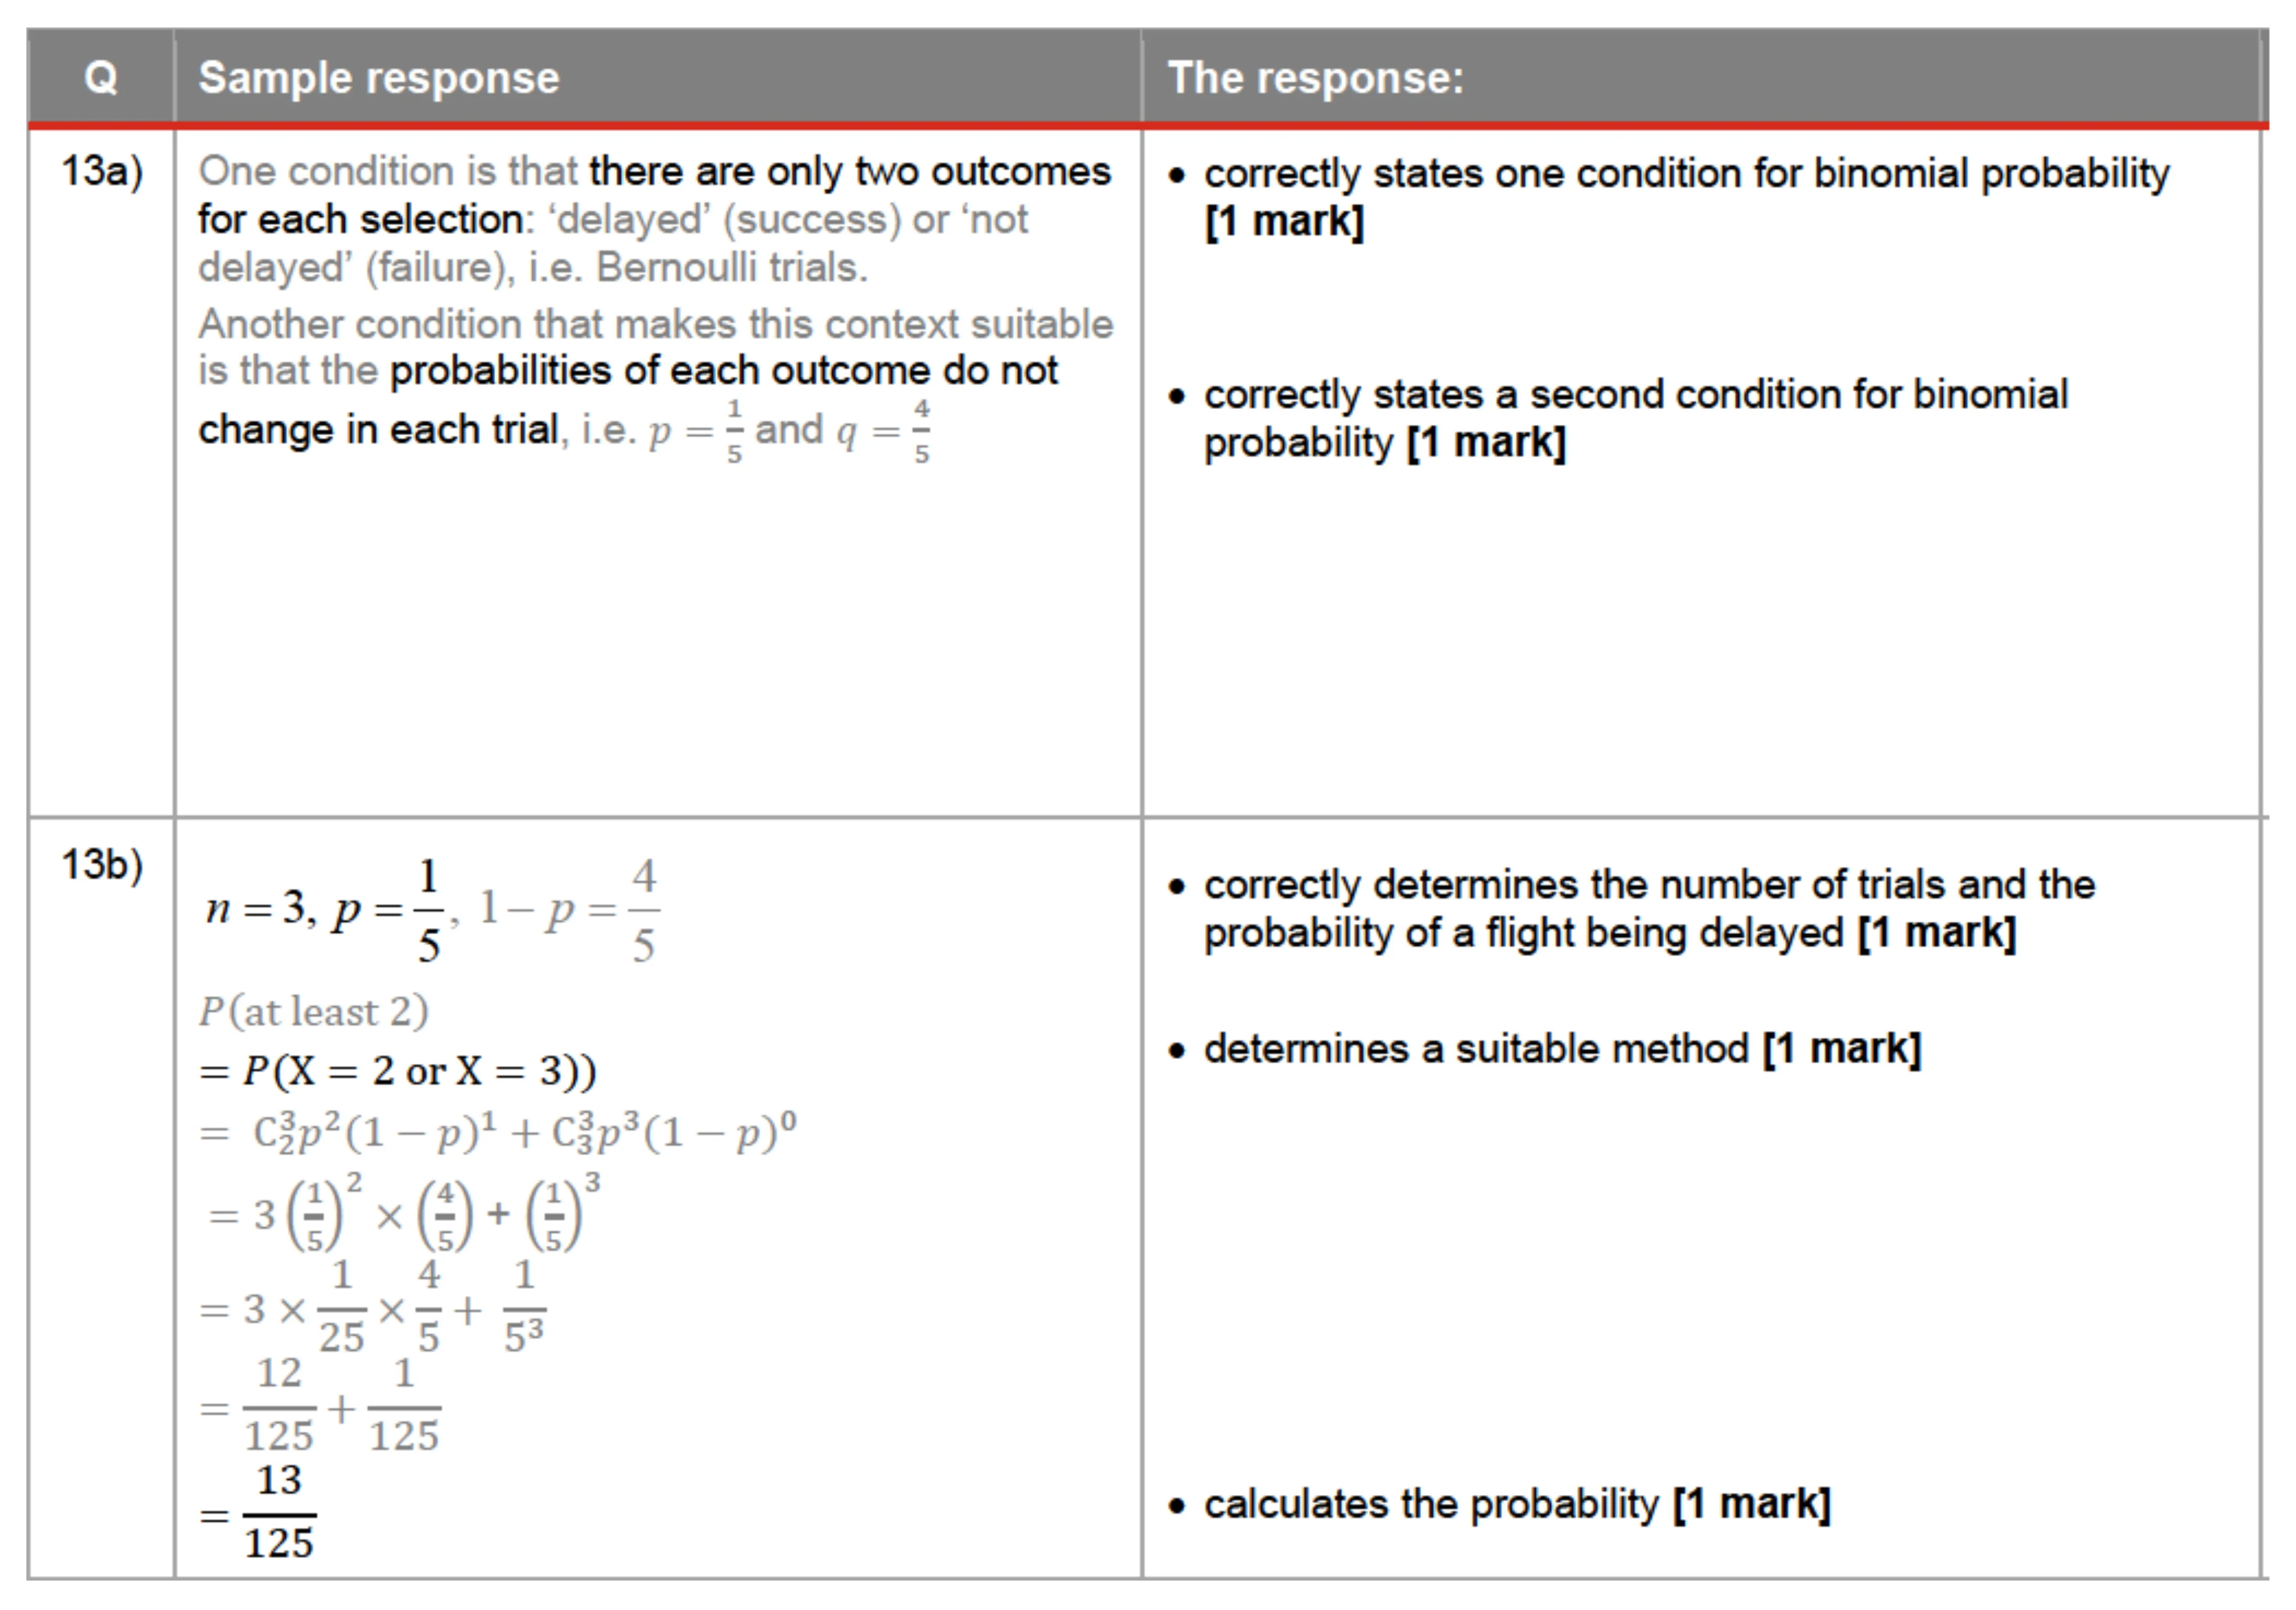
QUESTION 13 (5 marks) At a certain airport the departure of one in five international flights is delayed every day. The status of any flight is independent of other flights. One international flight is selected at random each day for three days. Each selection is recorded as either ‘delayed’ or ‘not delayed’. a) State two conditions that make this context suitable for modelling using a binomial random variable. [2 marks] b) Calculate the probability that at least two of the selected flights were delayed. [3 marks]
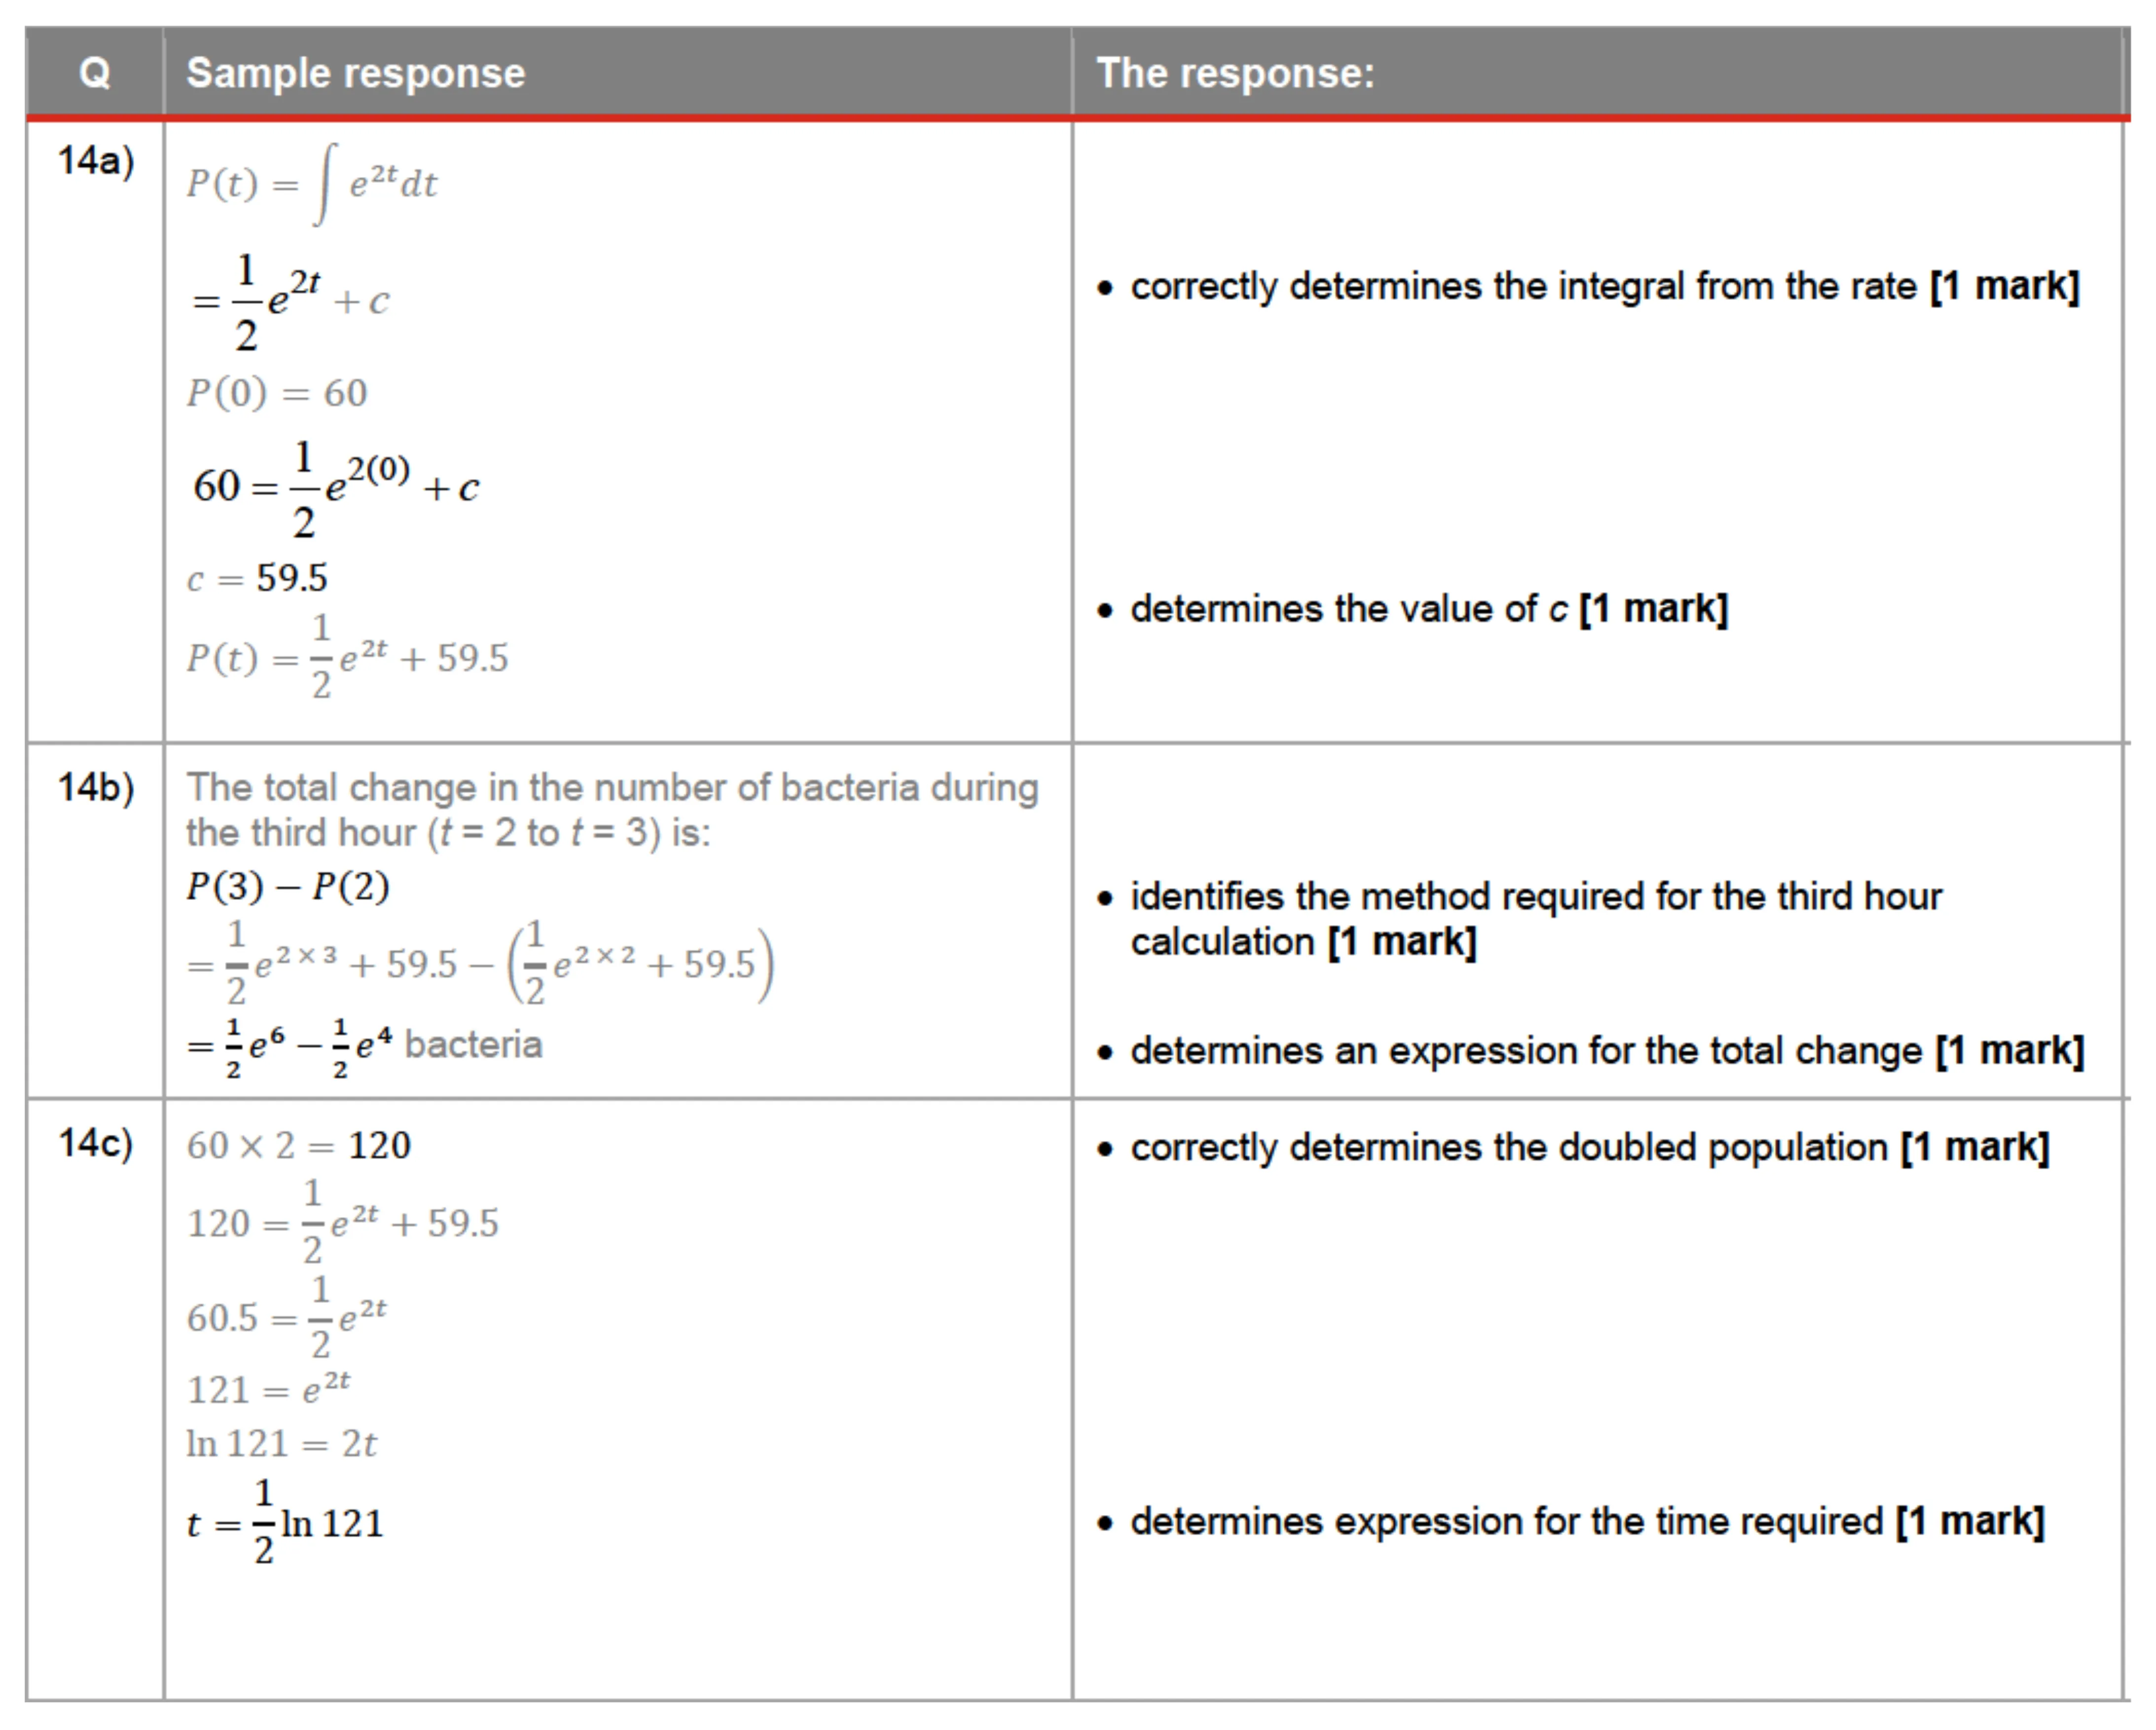
QUESTION 14 (6 marks) The rate of change in the number of bacteria in a science experiment is represented by < =e 420 where ¢ represents the time (hours) since starting the experiment and P represents the number of bacteria present (thousands). Initially there are 60 000 bacteria present i.e. P(O) = 60. a) Determine the equation for P(t). [2 marks] b) Determine the change in the number of bacteria during the third hour. Express your answer in terms of e. [2 marks] c) Determine how long it will take for the number of bacteria present to double after starting the experiment. [2 marks]
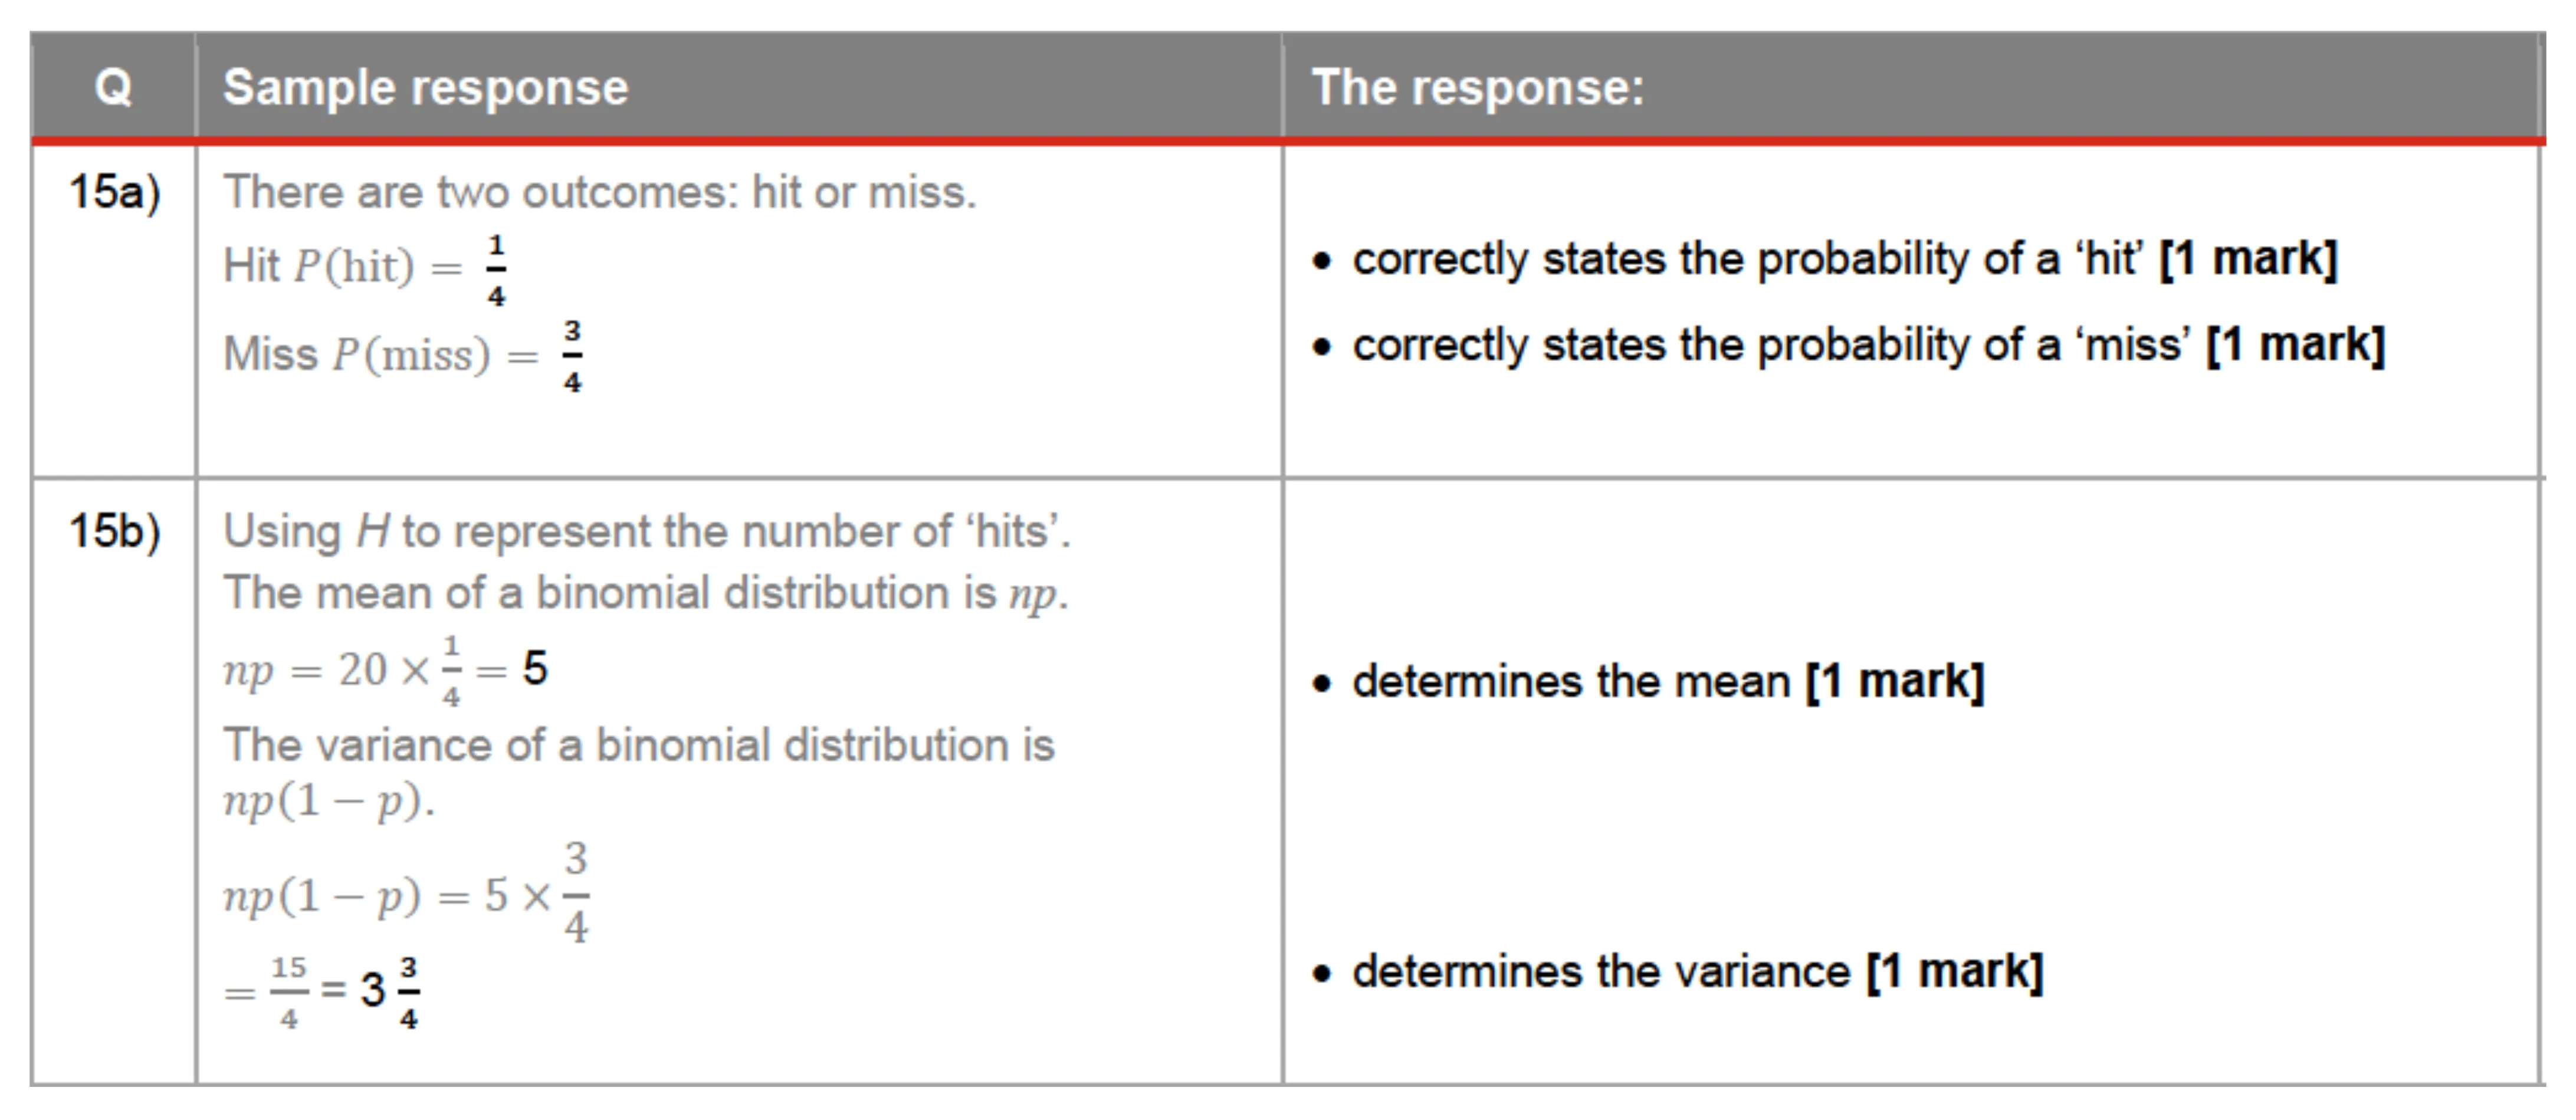
QUESTION 15 (4 marks) In a certain game players throw one water balloon at a target. There is a one in four chance of hitting the target. a) State the probabilities of all the possible outcomes for one throw at the target. [2 marks] b) Let H be the discrete random variable for one of the possible outcomes. Determine the mean and variance of the distribution of random variable H when 20 players throw [2 marks] a water balloon at the target.
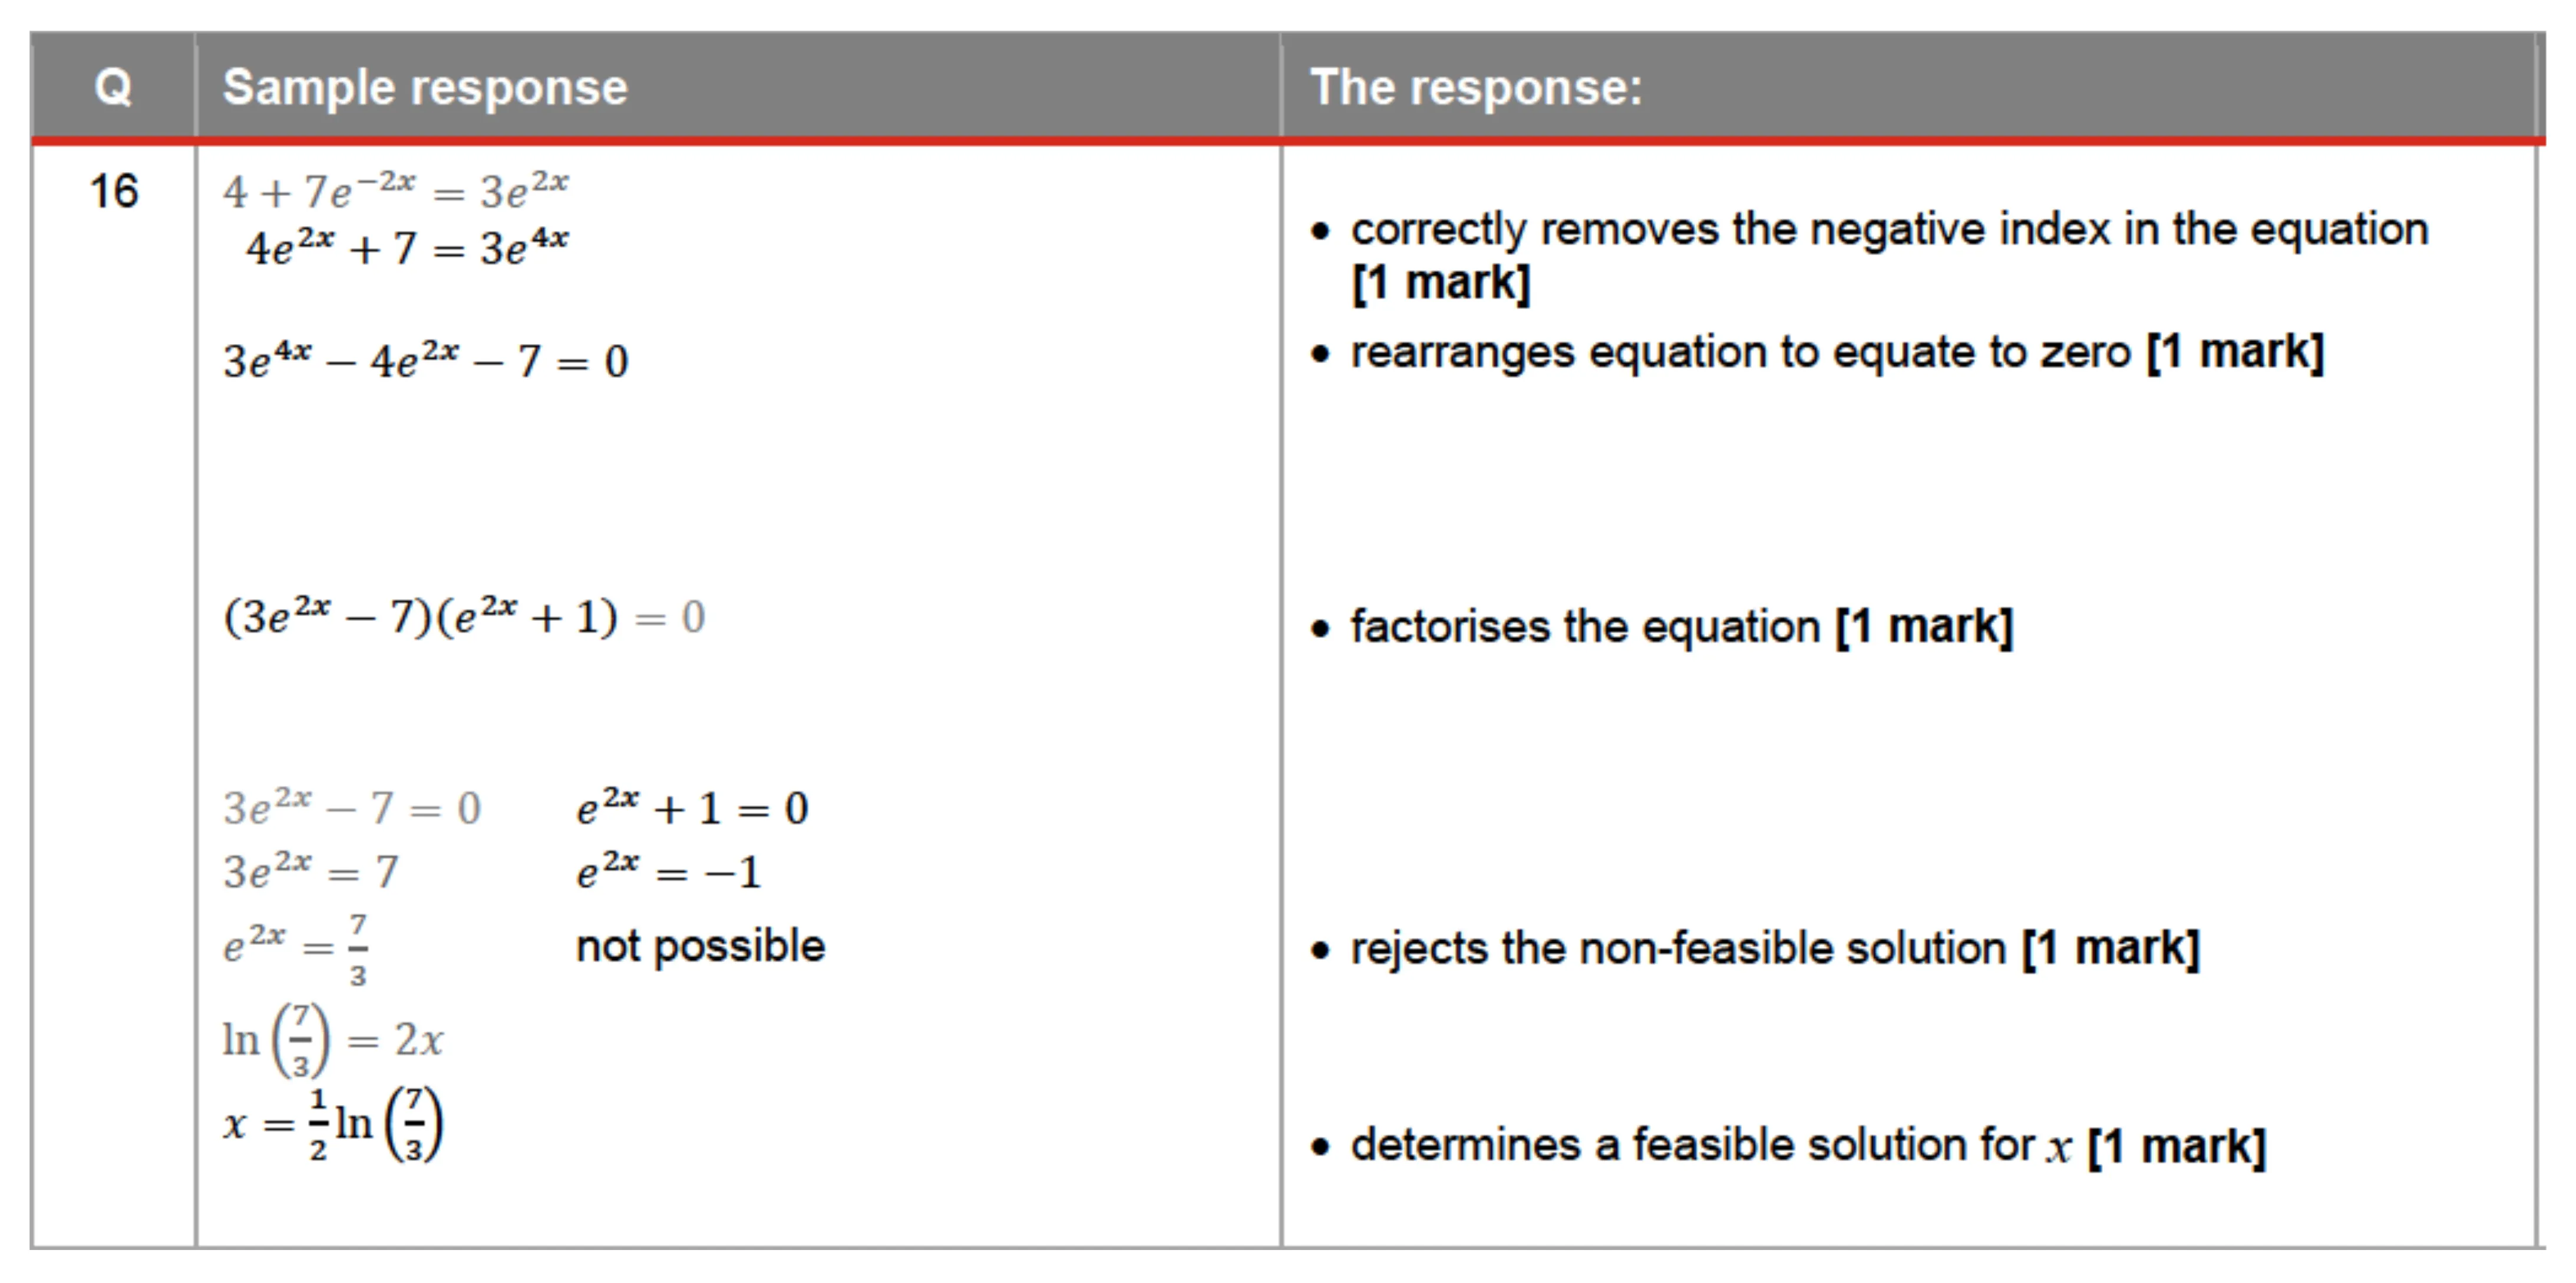
QUESTION 16 (5 marks) Solve for x in the equation 4+ 7e?* = 3e”.
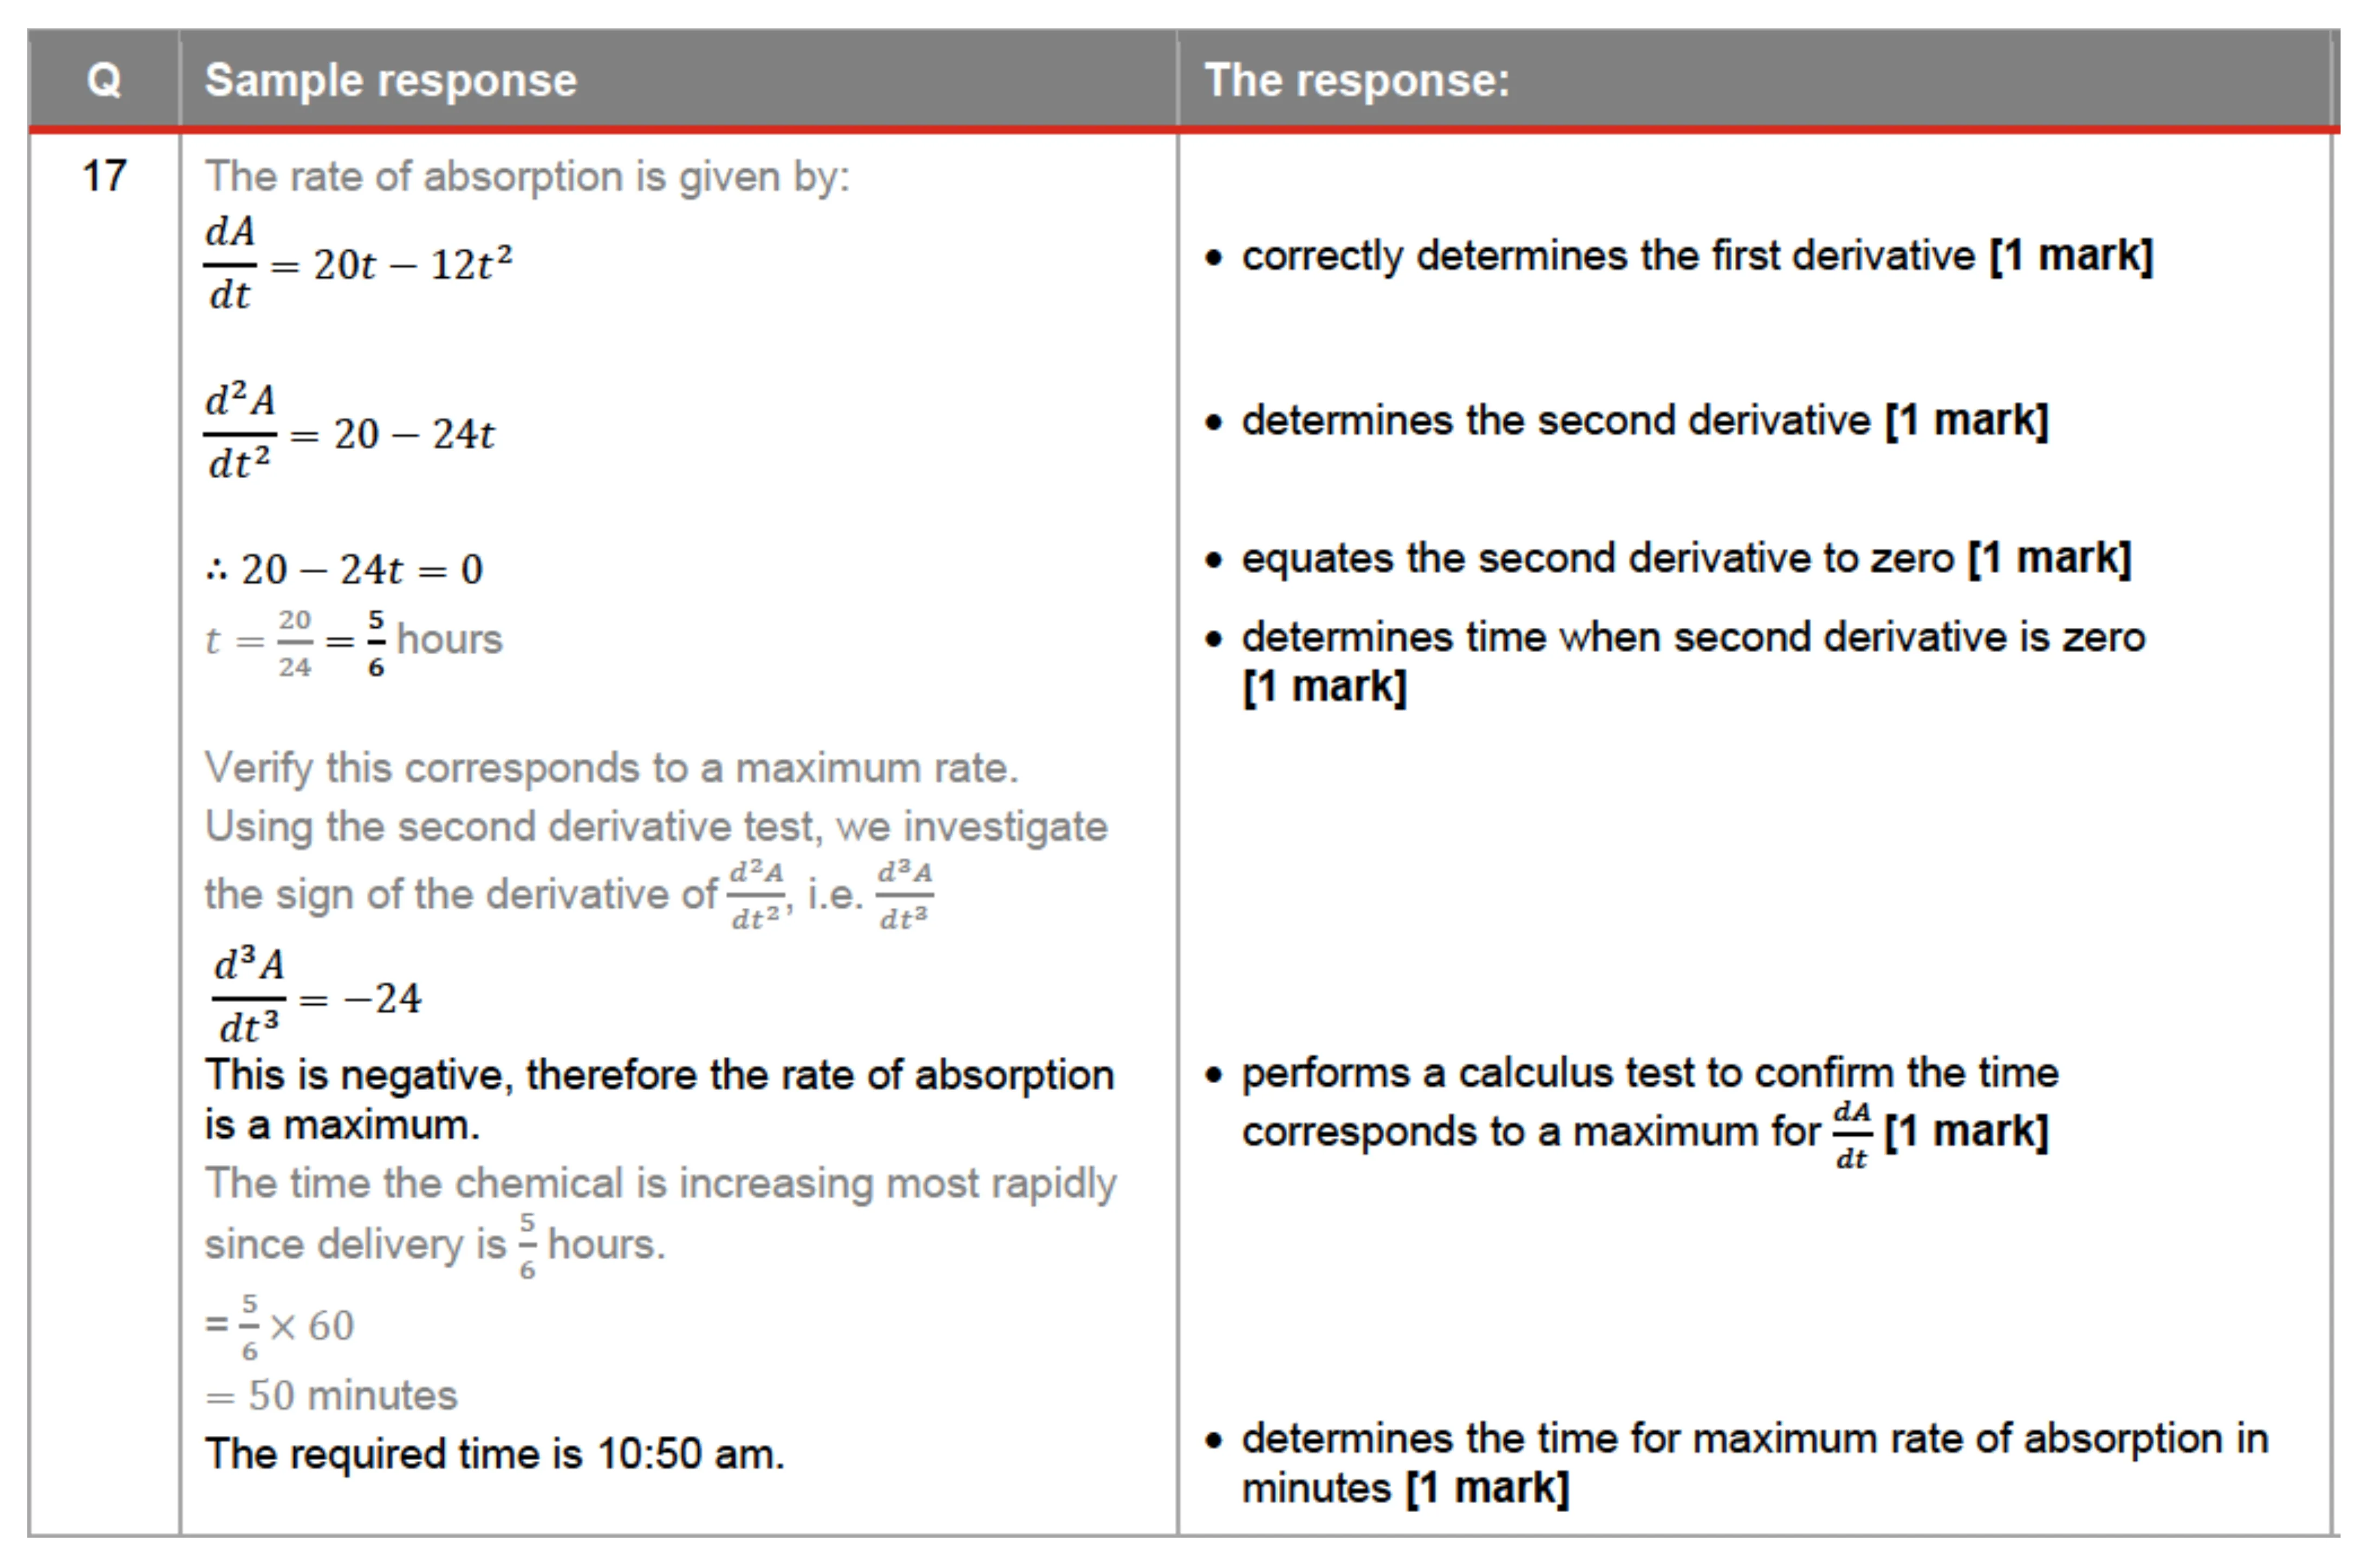
QUESTION 17 (6 marks) A chemical is added to the water in a swimming pool at 10:00 am to prevent algae. The amount of chemical absorbed into the water over time ¢ (hours) is represented by A=10t7 —4¢ ostsi Determine the time of day when the rate of absorption of the chemical is at its maximum. Use calculus techniques to verify that your time corresponds to a maximum rate.
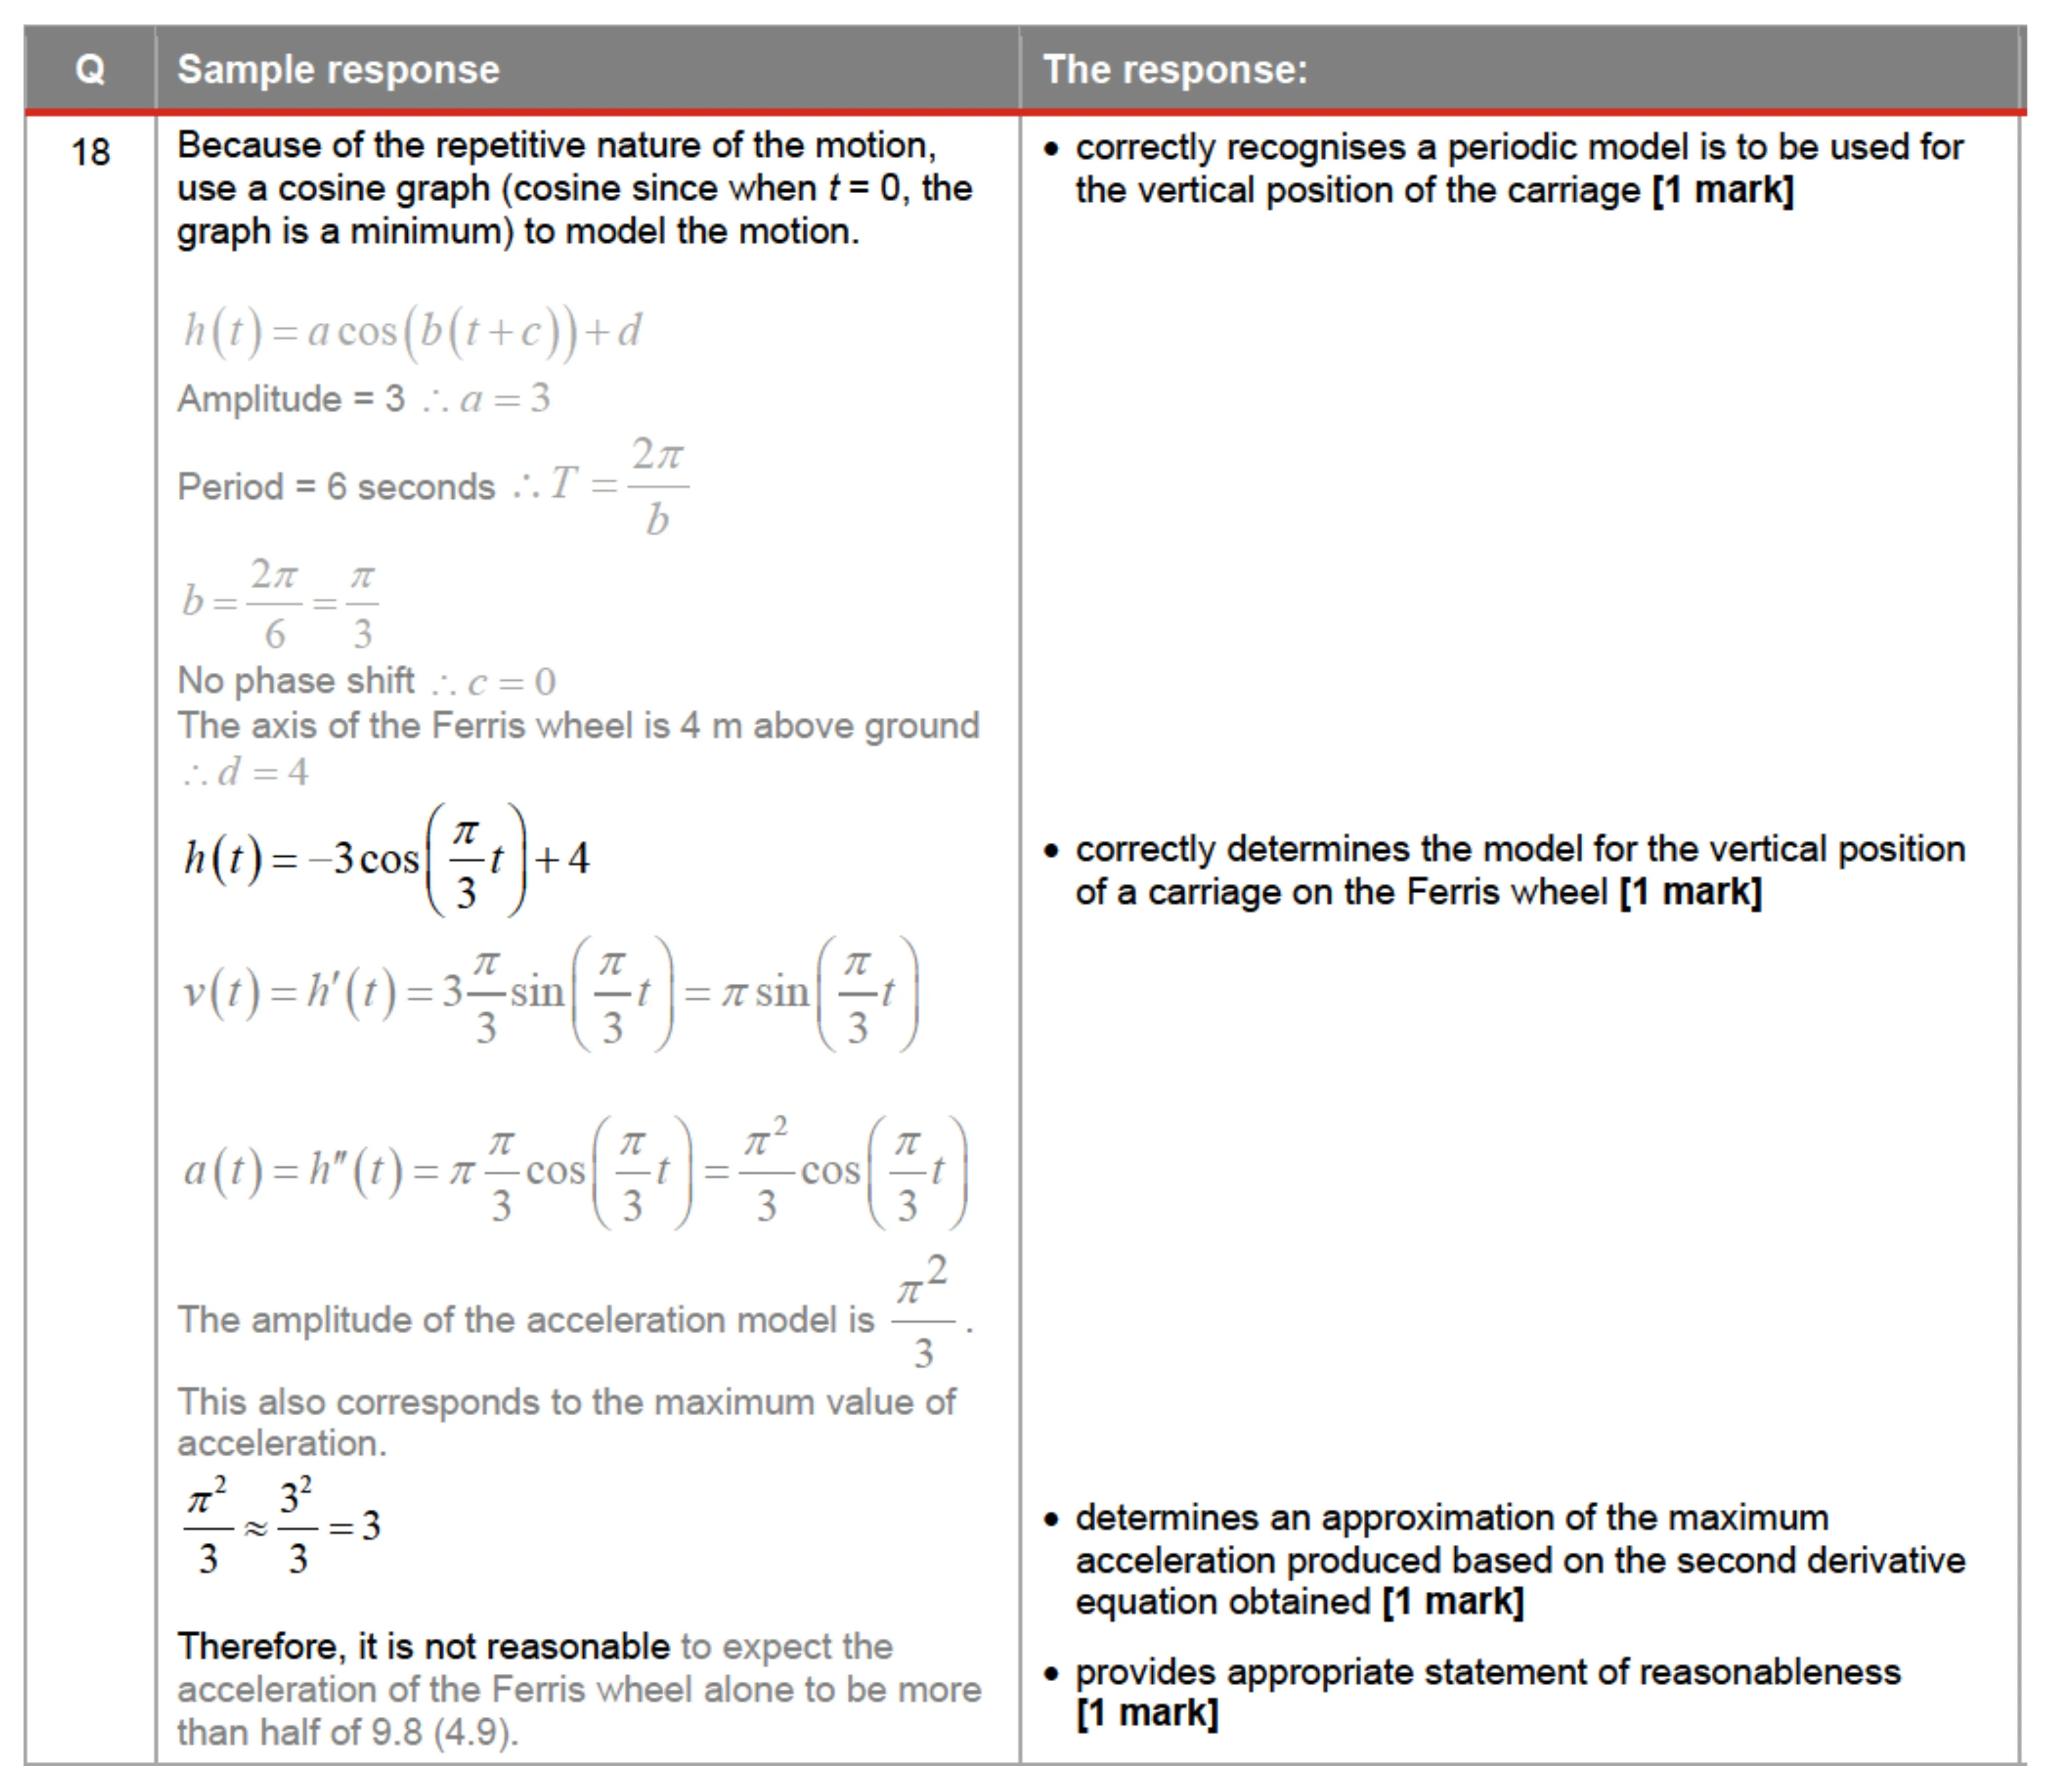
QUESTION 18 (4 marks) A person enters the lowest carriage of a miniature Ferris wheel with a six-metre diameter. The bottom carriage is one metre off the ground. When top speed is reached it takes three seconds for a carriage to travel from the lowest to the highest point of the ride. It is claimed that: The vertical motion of the Ferris wheel produces a maximum vertical acceleration on each rider that is more than half the acceleration of free fall. Free fall occurs when gravity is the only force acting resulting in an acceleration of 9.8 ms”. Evaluate the reasonableness of the claim.
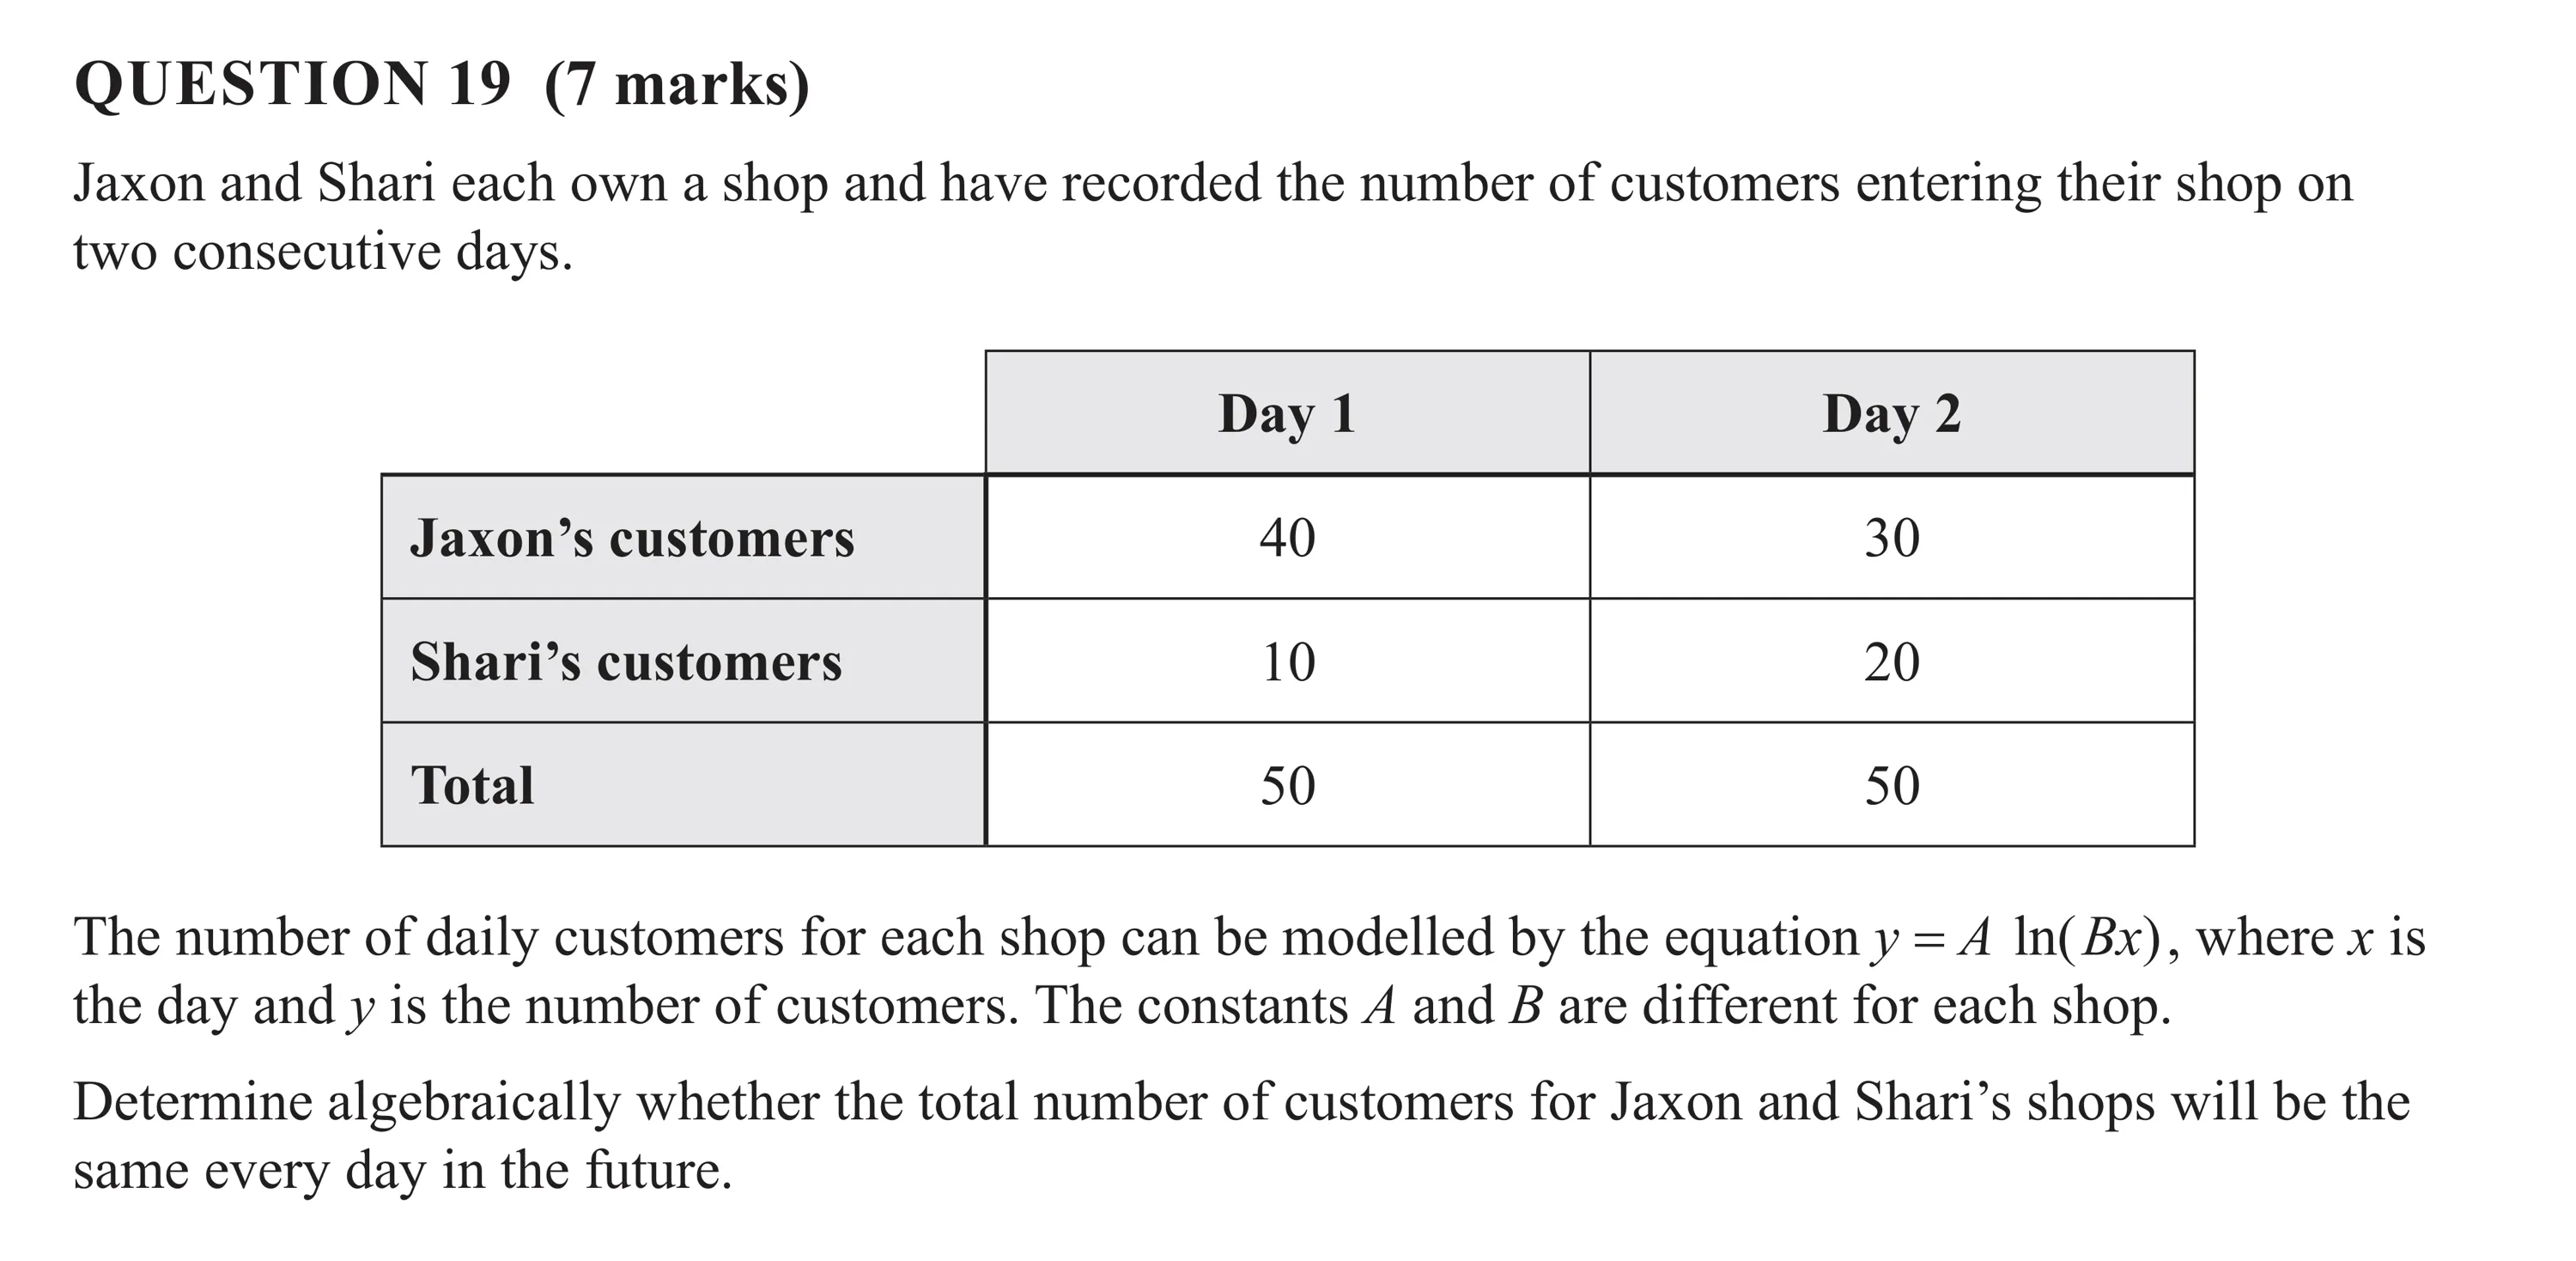
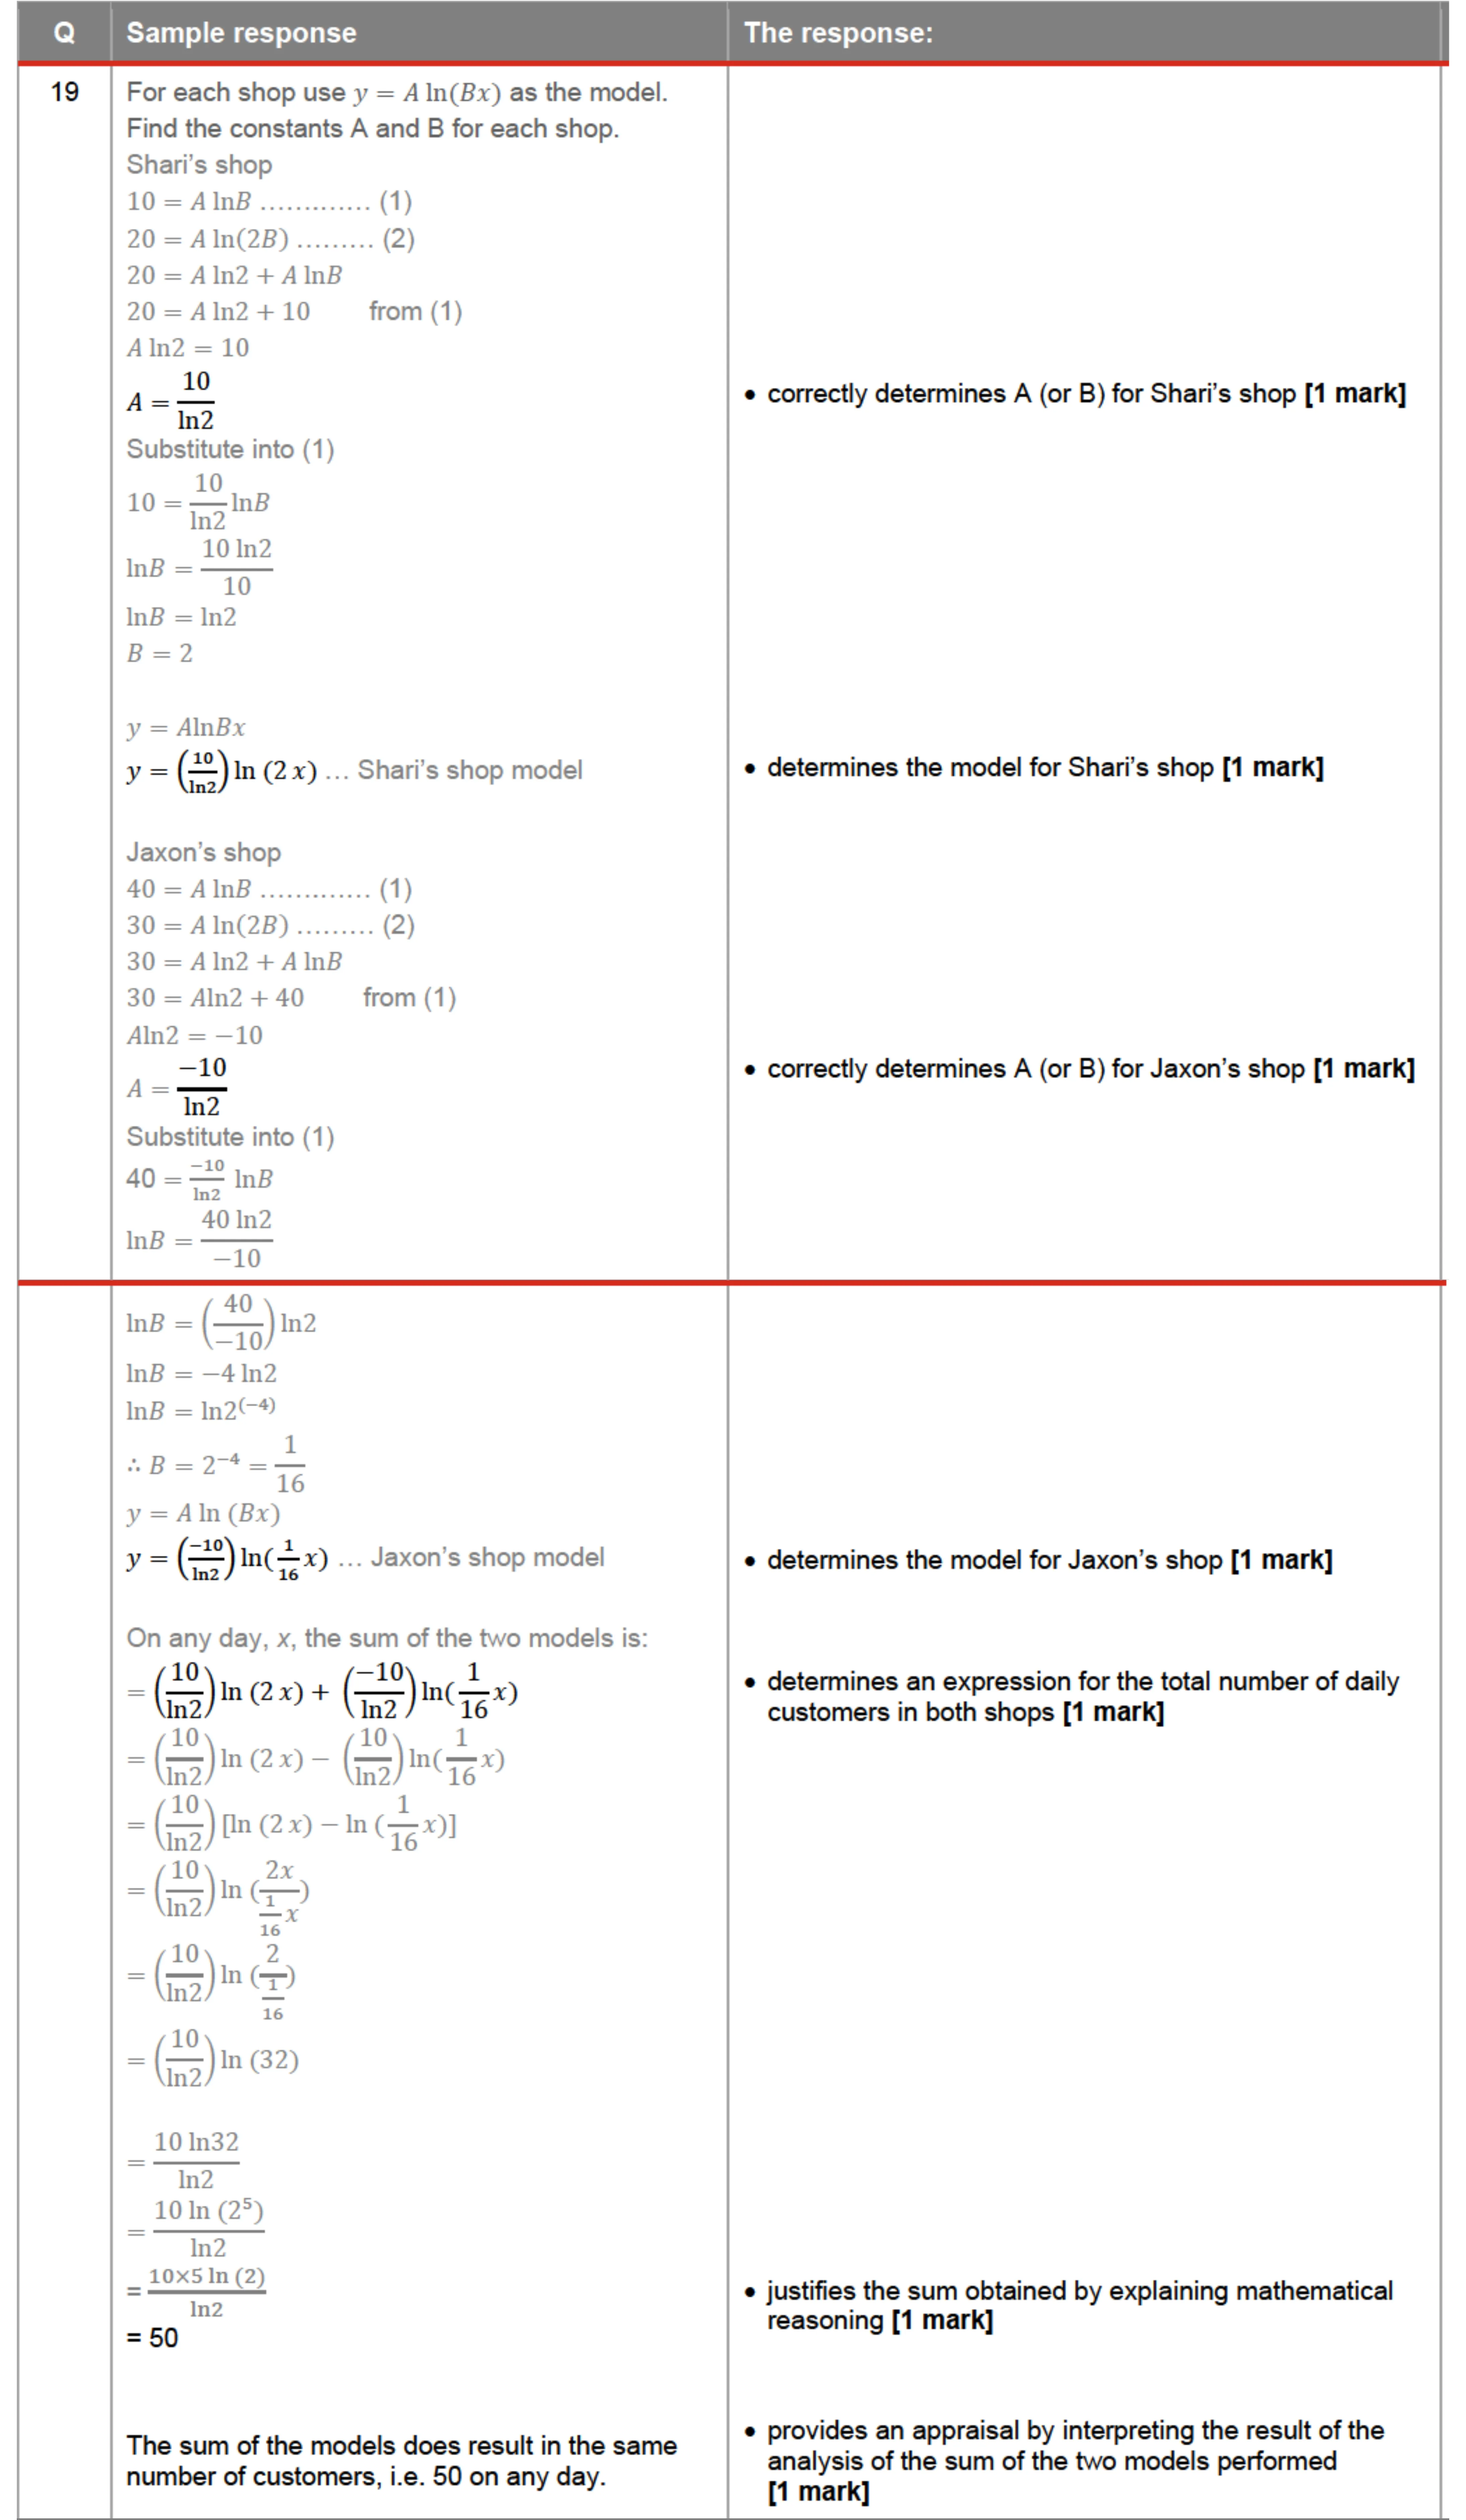
QUESTION 19 (7 marks) Jaxon and Shari each own a shop and have recorded the number of customers entering their shop on two consecutive days. The number of daily customers for each shop can be modelled by the equation y = A In( Bx) where x is the day and y is the number of customers. The constants A and B are different for each shop. Determine algebraically whether the total number of customers for Jaxon and Shari’s shops will be the same every day in the future.
QUESTION 1 If f(x) = sin(3x) determine the value of f {Z). (A) 2.772 (B) 1.148 (C) 0.929 (D) 0.383
QUESTION 2 The probability of hitting a bullseye on a standard dartboard is 1 in 1250. What is the probability of hitting a bullseye exactly once in 10 attempts? (Das) (is) ()(cea) *(ias0) © (aa) *(i) (saa) *(ias0) (B) (D)
QUESTION 3 In a certain normal distribution curve 95% of the area lies between the values 50.32 and 113.68. The mean of this distribution is 82. Determine the standard deviation. (A) 16.16 (B) 21.12 (C) 31.68 (D) 63.36
QUESTION 4 The displacement (m) of a moving particle is given by d = e°°! _1 where ¢ is time (s). The acceleration (ms~”) of the particle when t= 4 is (A) 7.3891 (B) 6.3891 (C) 3.6945 (D) 1.8473
QUESTION 5 Solve In(x) + In(3.70) = In(9.25) for x. (A) 0.92 (B) 1.71 (C) 2.50 (D) 5.55
QUESTION 6 Sa | ; | dx a#0is a x+a (A) 1.7918 (B) 1.6094 (C) 1.3863 (D) 1.0986
QUESTION 7 The distribution of a certain sample proportion has a mean of 0.70 and a standard deviation of 0.02. Determine the sample size. (A) 525 (B) 750 (C) 1750 (D) 2500
QUESTION 8 The number of koalas in a conservation park is modelled by N= 15 In(7t+ 1) t = 1 where ¢ represents the time (years) since the park opened. There were 20 koalas in the park when it opened. Determine the approximate rate of change in the number of koalas when f= 3. (A) 46 (B) 26 (C) 25 (D) 5
QUESTION 9 If f(x) = e?*(x+1) and f(x) = ae**(x + 1) determine the expression for a. (A) 3x45 (B) 3x+3 (C) S5x+5 (D) 5x+3
QUESTION 10 A student is trying to determine which subject they performed best in compared to other students. Results from recent tests in four subjects (A to D) are shown. Assume student results in each subject are normally distributed. In which subject did the student perform best compared to other students? Class standard Class mean a deviation Student’s result
QUESTION 11 (4 marks) A researcher found that 17 out of 50 randomly selected people had used public transport in the past week. a) Determine the sample proportion of people who had used public transport in the past week. [1 mark] b) Determine an approximate 95% confidence interval for the proportion of people who had used public transport in the past week. [2 marks] c) Someone claims that: 50% of people use public transport each week. Use your answer from Question 11b) to explain whether the data can or cannot support this claim. [1 mark]
QUESTION 12 (4 marks) The graph shows the water level under a bridge over a 12-hour period. a) b) Water level (metres) 12:00 am 4:00 am 8:00 am 12:00 pm Time Determine the equation of the cosine function that models the water level as a function of time after 12:00 am. [1 mark] How long in the 12-hour period shown is the rate of change of water level more than 0.55 metres per hour? [3 marks]
QUESTION 13 (4 marks) The curved lines represent graphs of the equations y = x7 —4x+8 and y= 10cos(x +10). y a) Determine the coordinates of the points of intersection A and B. [1 mark] b) State an integral expression representing the area enclosed by the two graphs. [2 marks] c) Determine the area enclosed by the two graphs. [1 mark]
QUESTION 14 (7 marks) A fence divides a paddock into two triangular sections as shown. 900 m 540 m Not to scale 500 m a) Determine the length of the fence. b) Calculate the area of triangular section A. c) Determine the total area of the paddock. [1 mark] [1 mark] [5 marks]
QUESTION 15 (4 marks) Determine the derivative of f (x) =Inx? + In(x —35 y. Express the derivative as a single fraction in its simplest and factorised form.
QUESTION 16 (6 marks) A particle is moving in a straight line. The velocity (ms!) of the particle is given by 20sin (2t v(t) =e) 6 —5cos(2r) The initial position of the particle is +6.0 m from the origin. t > 0 where ¢ is time (s) after moving from its initial position. a) Use calculus methods to determine an equation for the position of the particle from the origin at any time ¢. b) Determine the position of the particle relative to the origin when it first reaches maximum velocity. [3 marks] [3 marks]
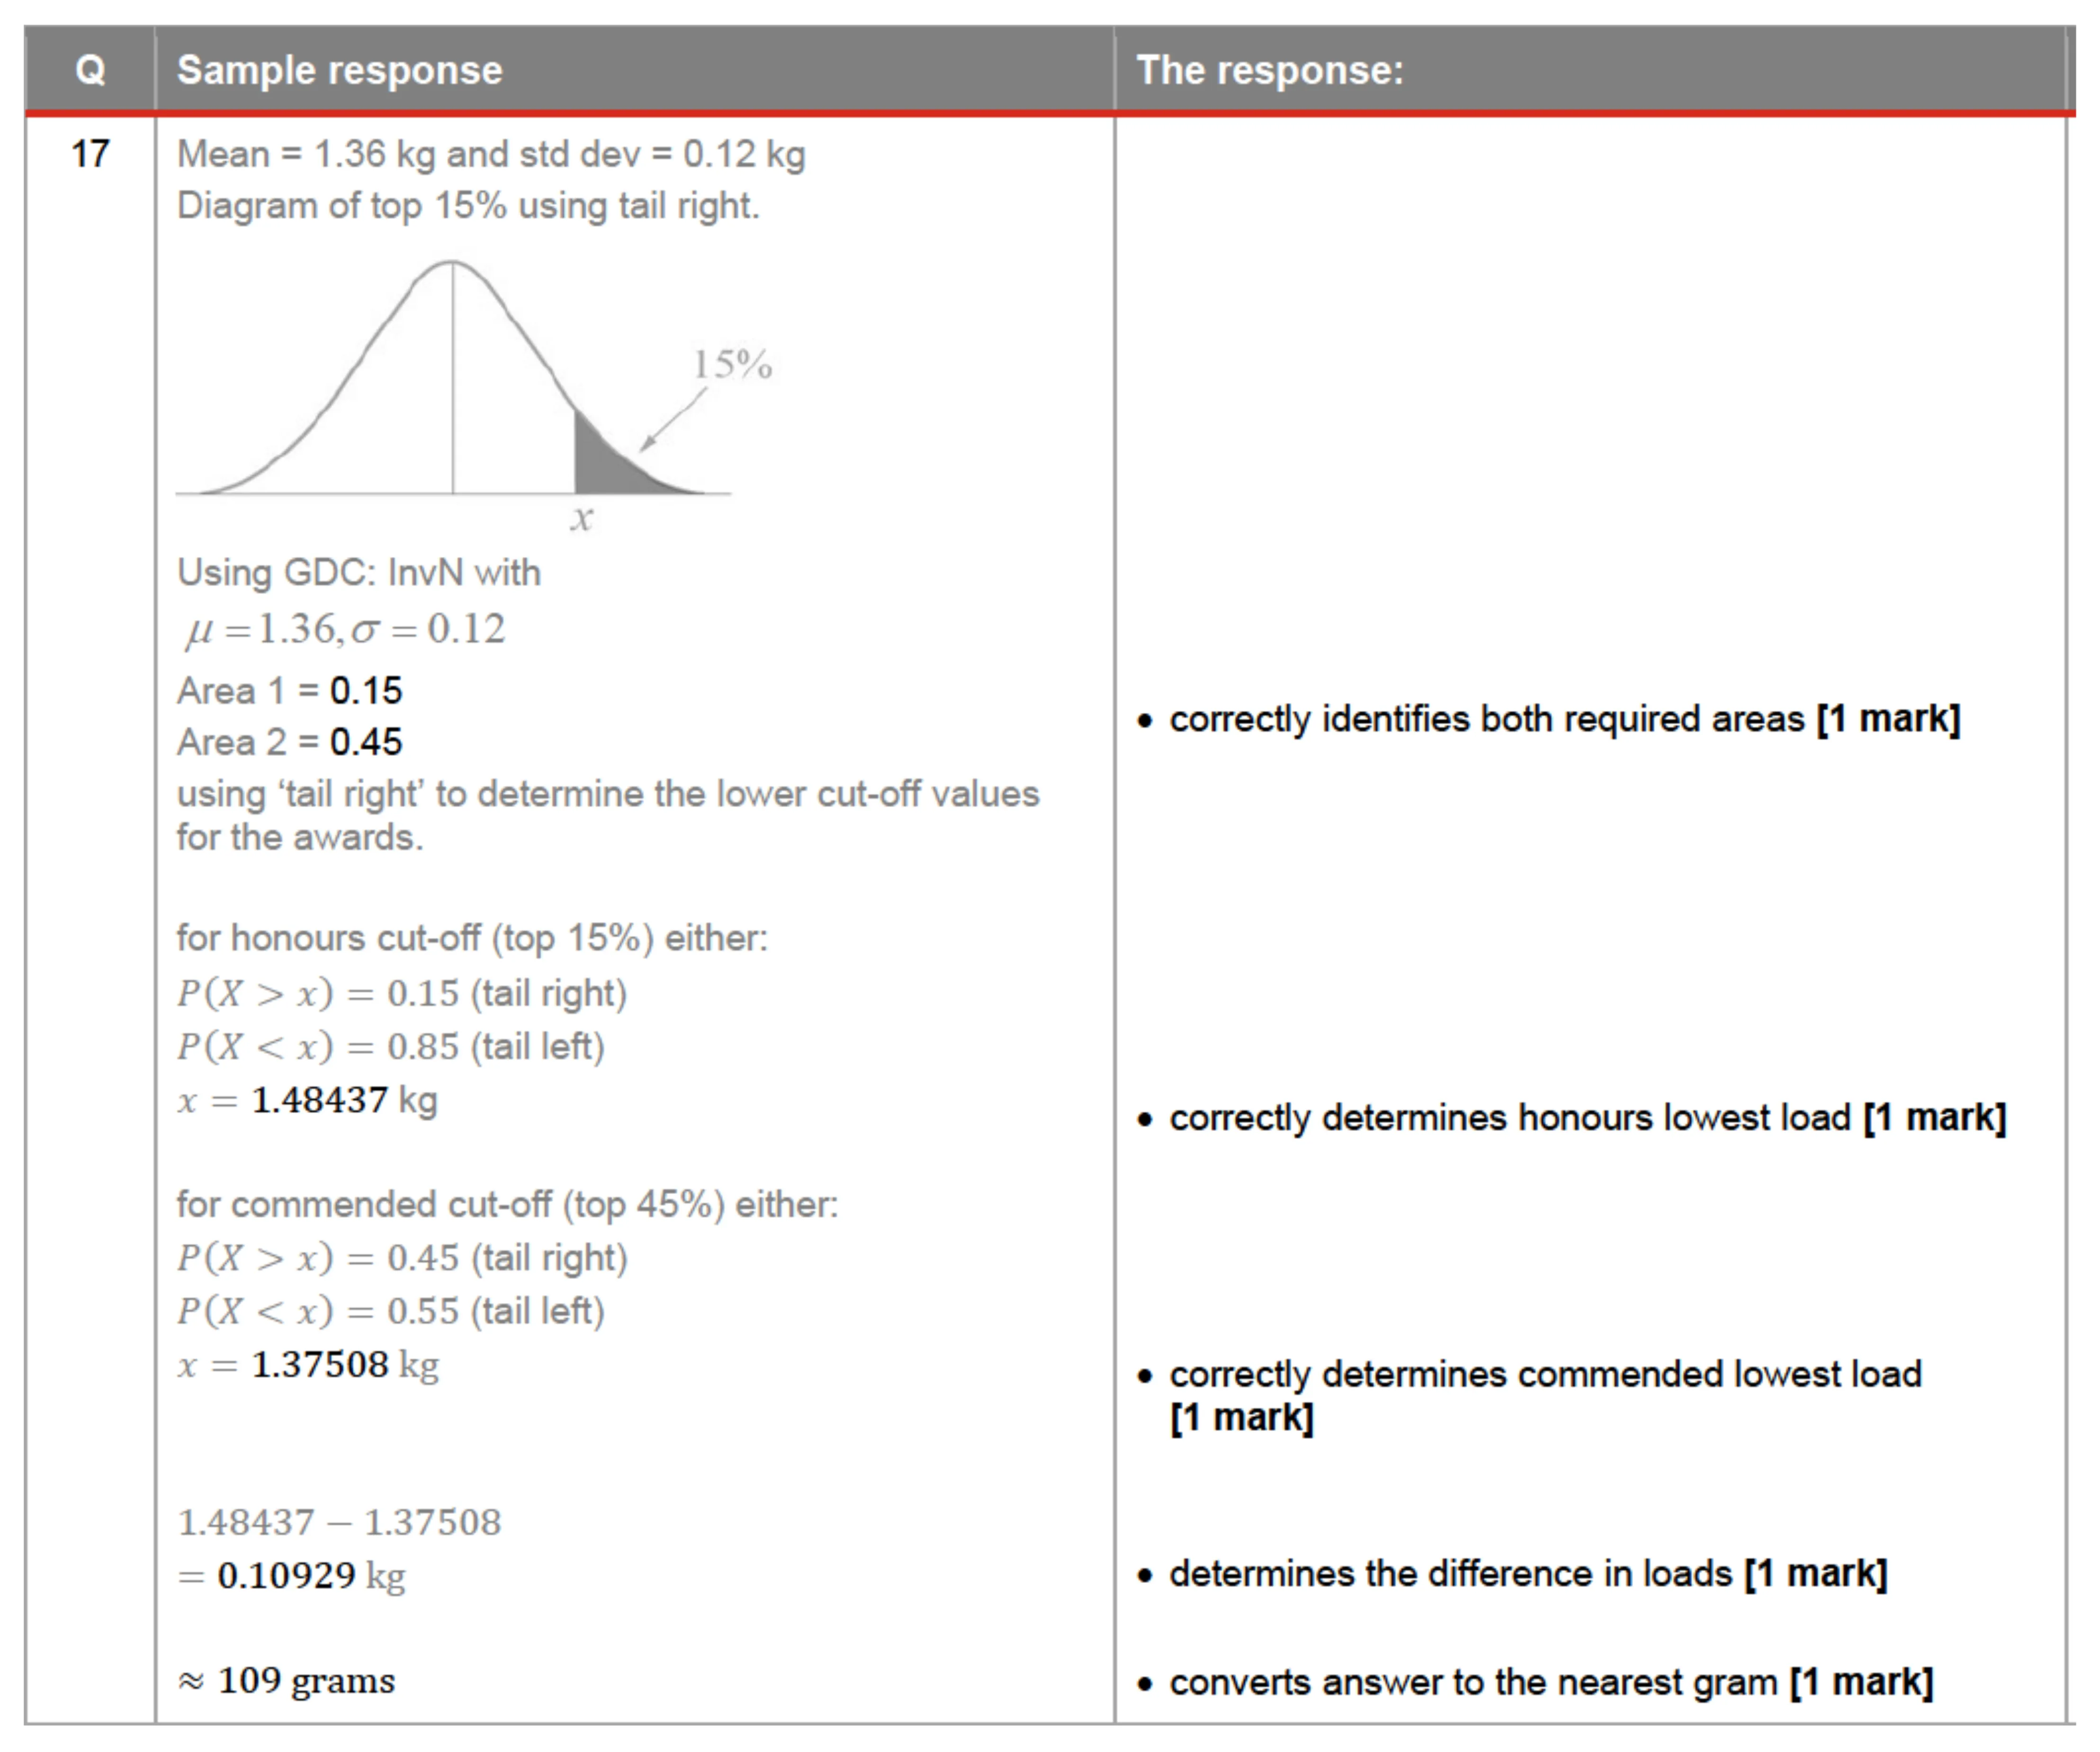
QUESTION 17 (5 marks) Model bridges were constructed for a competition. The models that could support the heaviest loads before collapsing were given awards. The load results of the competition were normally distributed with a mean of 1.36 kg and a standard deviation of 0.12 kg. Three award categories were used: honours for the top 15% of load results; distinction for the next 15%; and commendation for the next 15%. The model bridge constructed by Finley only just missed out on a commendation. Kirby’s model bridge only just qualified for honours. Determine the difference to the nearest gram between the loads supported by Finley and Kirby’s models.
QUESTION 18 (5 marks) A company makes windows using glass that has a mass of 5.6 kg per square metre. A customer orders an unusual window in a partial parabolic shape as shown. Not to scale 8m Determine the mass of the window.
QUESTION 19 (6 marks) Over a suitable domain a hill has a cross-sectional area given by fr (x) dx = a +c where: ¢ a b and c are constants b+0 ¢ h(x) represents vertical distance (m) x represents horizontal distance (m). It is known that 4(0) = 1.22 and h(40) = 25. Where the gradient of the hill is 0.86 there is a tree stump. A second tree stump is located further up the hill. The difference in hill gradient between the two tree stumps is 0.44. A surveyor predicts that the vertical distance separating the two tree stumps is between 7.5 m and 8.5 m. Evaluate the reasonableness of this prediction.
No results found
open_with


