
view_agenda
Questions
Find the perfect question by filtering through every previous QCAA Biology external exam question
Question Classifications
We’re conducting a final review of the classifications and formatting for our recently onboarded questions. If you have any feedback, please share it with us here.
QUESTION 1 In prokaryotes deoxyribonucleic acid (DNA) is found as unbound circular DNA in the (A) mitochondria. (B) chloroplasts. (C) nucleus. (D) cytosol.
![Question-Image]()
![Answer-Image]()

Difficulty: C
-
Paper 1
-
2020

QUESTION 2 Which form of inheritance usually determines traits that display continuous phenotypic variation? (A) polygenic (B) sex-linked (C) multiple allele (D) incomplete dominance
![Question-Image]()
![Answer-Image]()

Difficulty: C
-
Paper 1
-
2020

QUESTION 3 A genome is defined as (A) the molecular unit of heredity. (B) all the genetic material in the chromosomes of an organism. (C) the sequence of triplets of DNA nucleotides that make up a gene. (D) the combination of alleles for a particular trait carried by an individual.
![Question-Image]()
![Answer-Image]()

Difficulty: C
-
Paper 1
-
2020

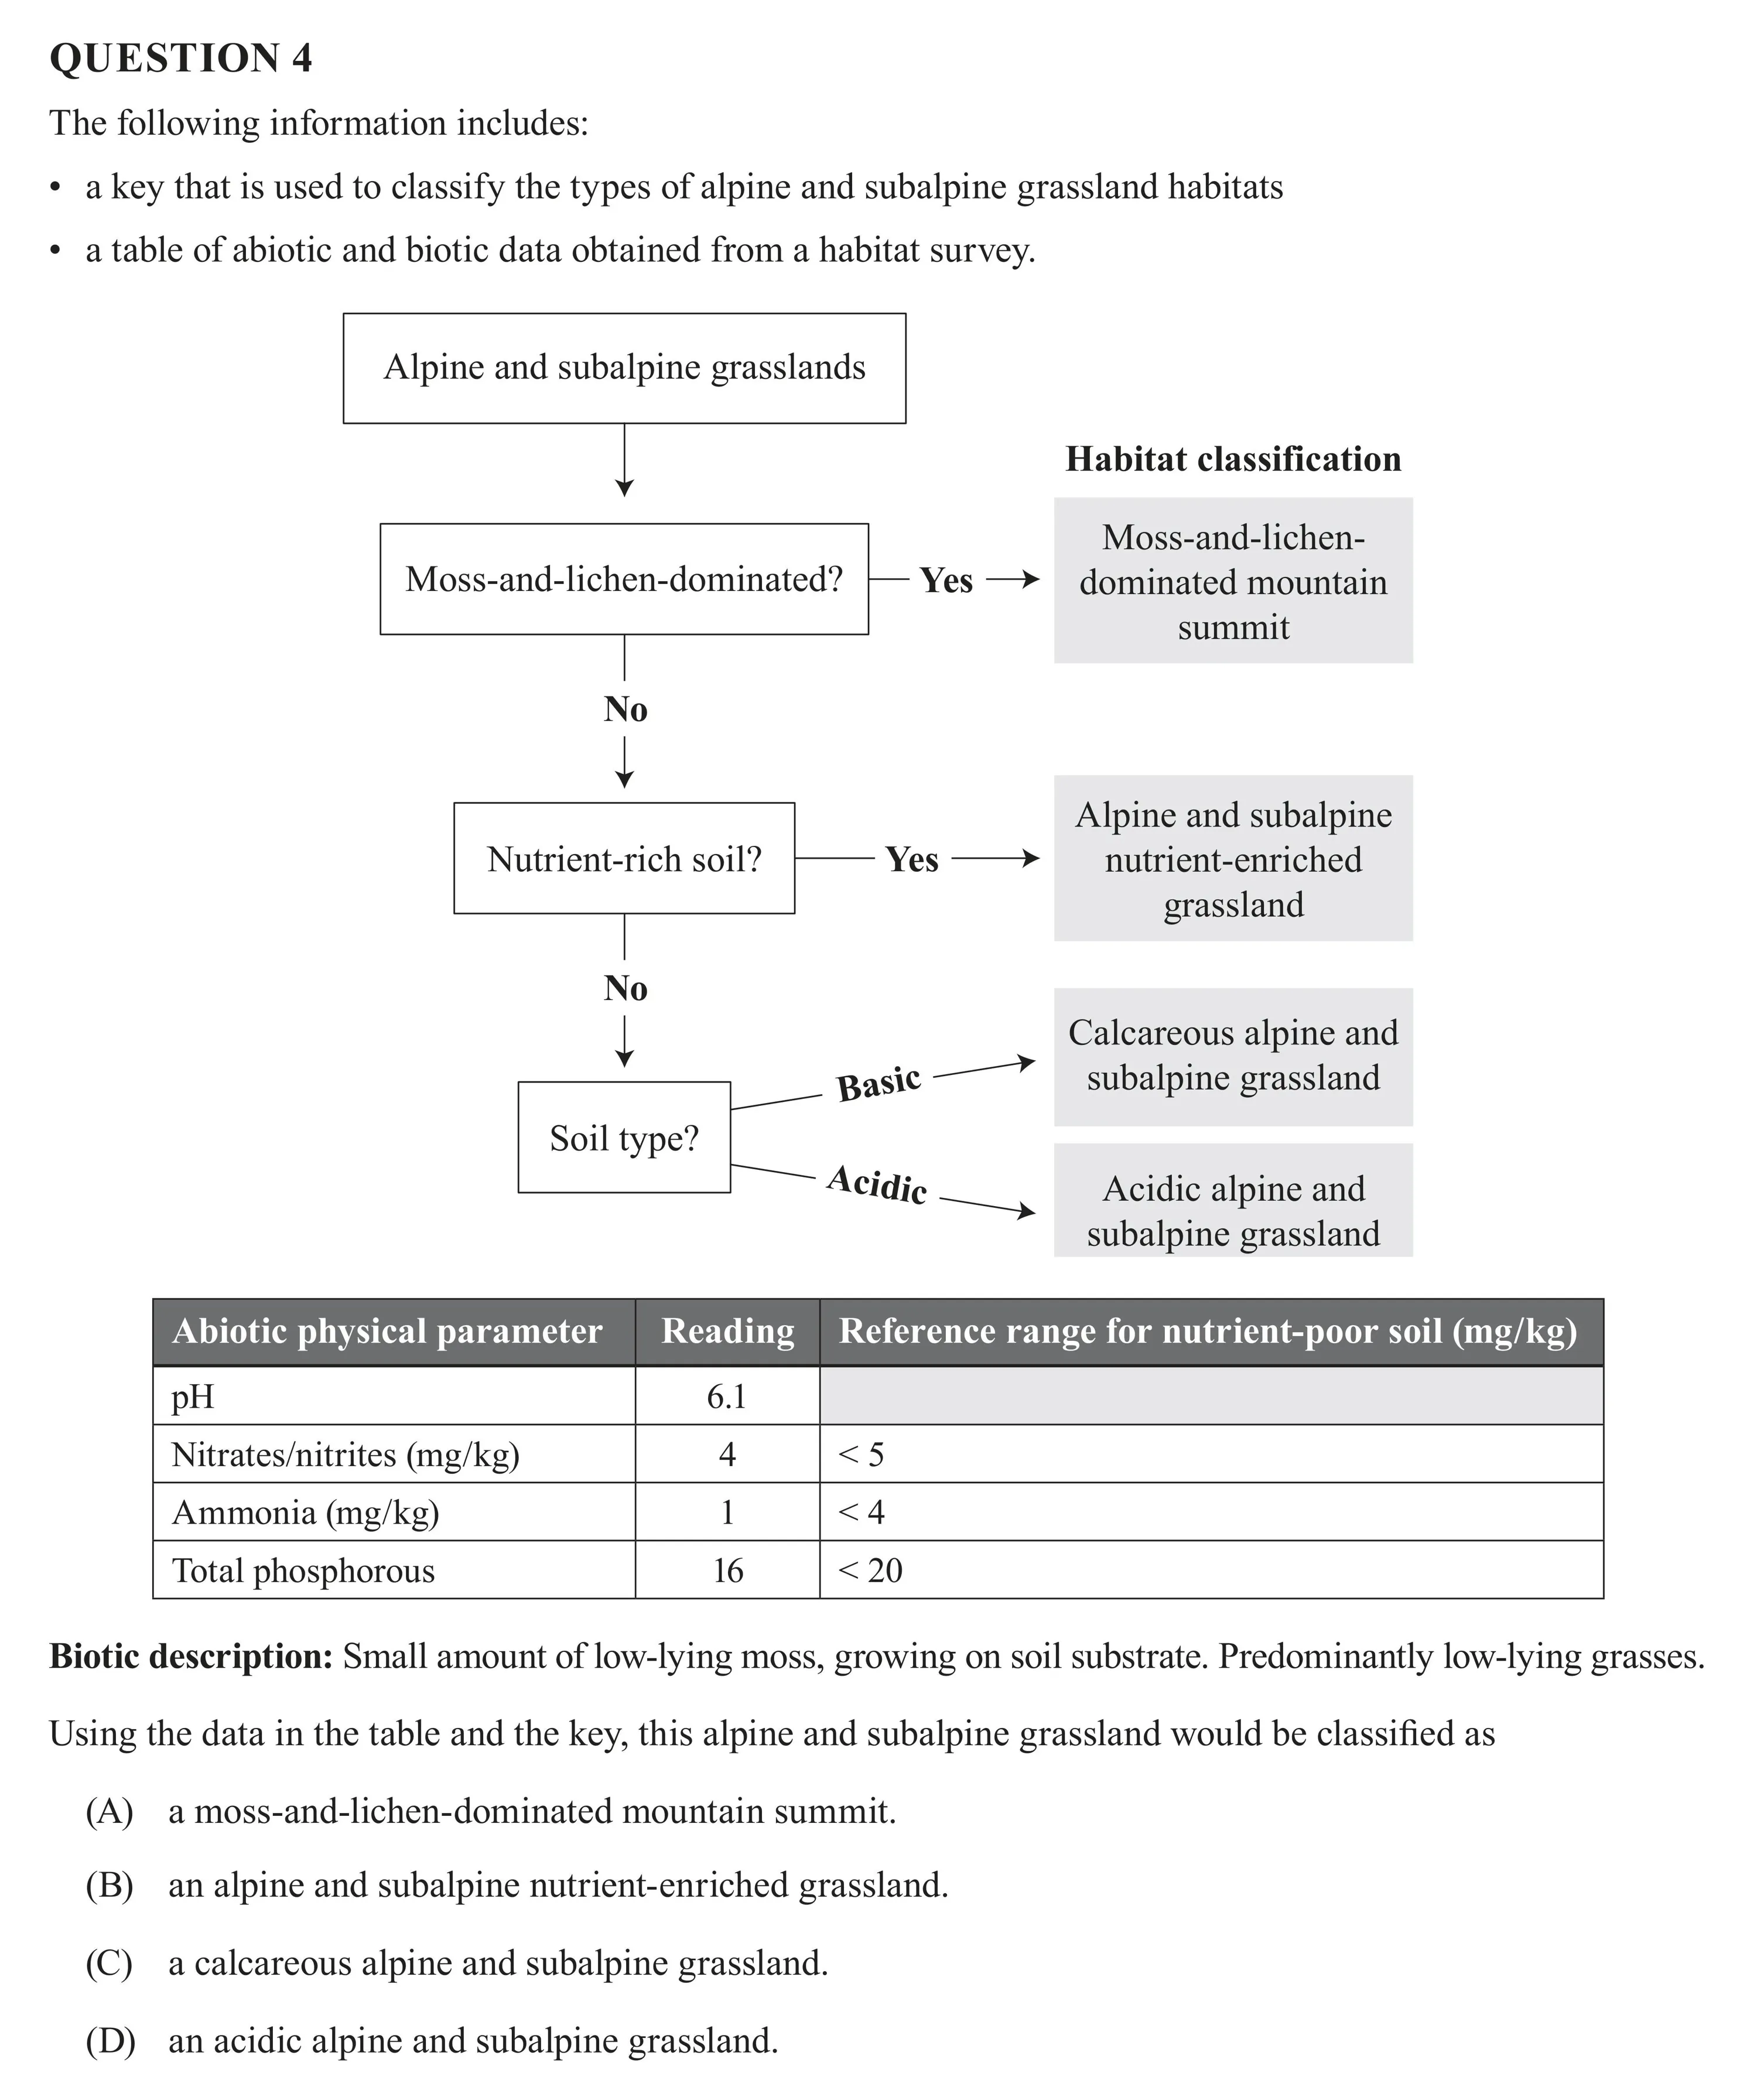
QUESTION 4 The following information includes: » akey that is used to classify the types of alpine and subalpine grassland habitats « atable of abiotic and biotic data obtained from a habitat survey. Alpine and subalpine grasslands Habitat classification Moss-and-lichen- Yes — dominated mountain summit Alpine and subalpine Yes —> nutrient-enriched grassland Calcareous alpine and Basic — subalpine grassland Acidie — Adcidicalpine and subalpine grassland Abiotic physical parameter Reading Reference range for nutrient-poor soil (mg/kg) Nitrates/nitrites (mg/kg) Ammonia (mg/kg) Total phosphorous Biotic description: Small amount of low-lying moss growing on soil substrate. Predominantly low-lying grasses. Using the data in the table and the key this alpine and subalpine grassland would be classified as (A) amoss-and-lichen-dominated mountain summit. (B) an alpine and subalpine nutrient-enriched grassland. (C) acalcareous alpine and subalpine grassland. (D) an acidic alpine and subalpine grassland.
![Question-Image]()
![Answer-Image]()
Difficulty: C
-
Paper 1
-
2020

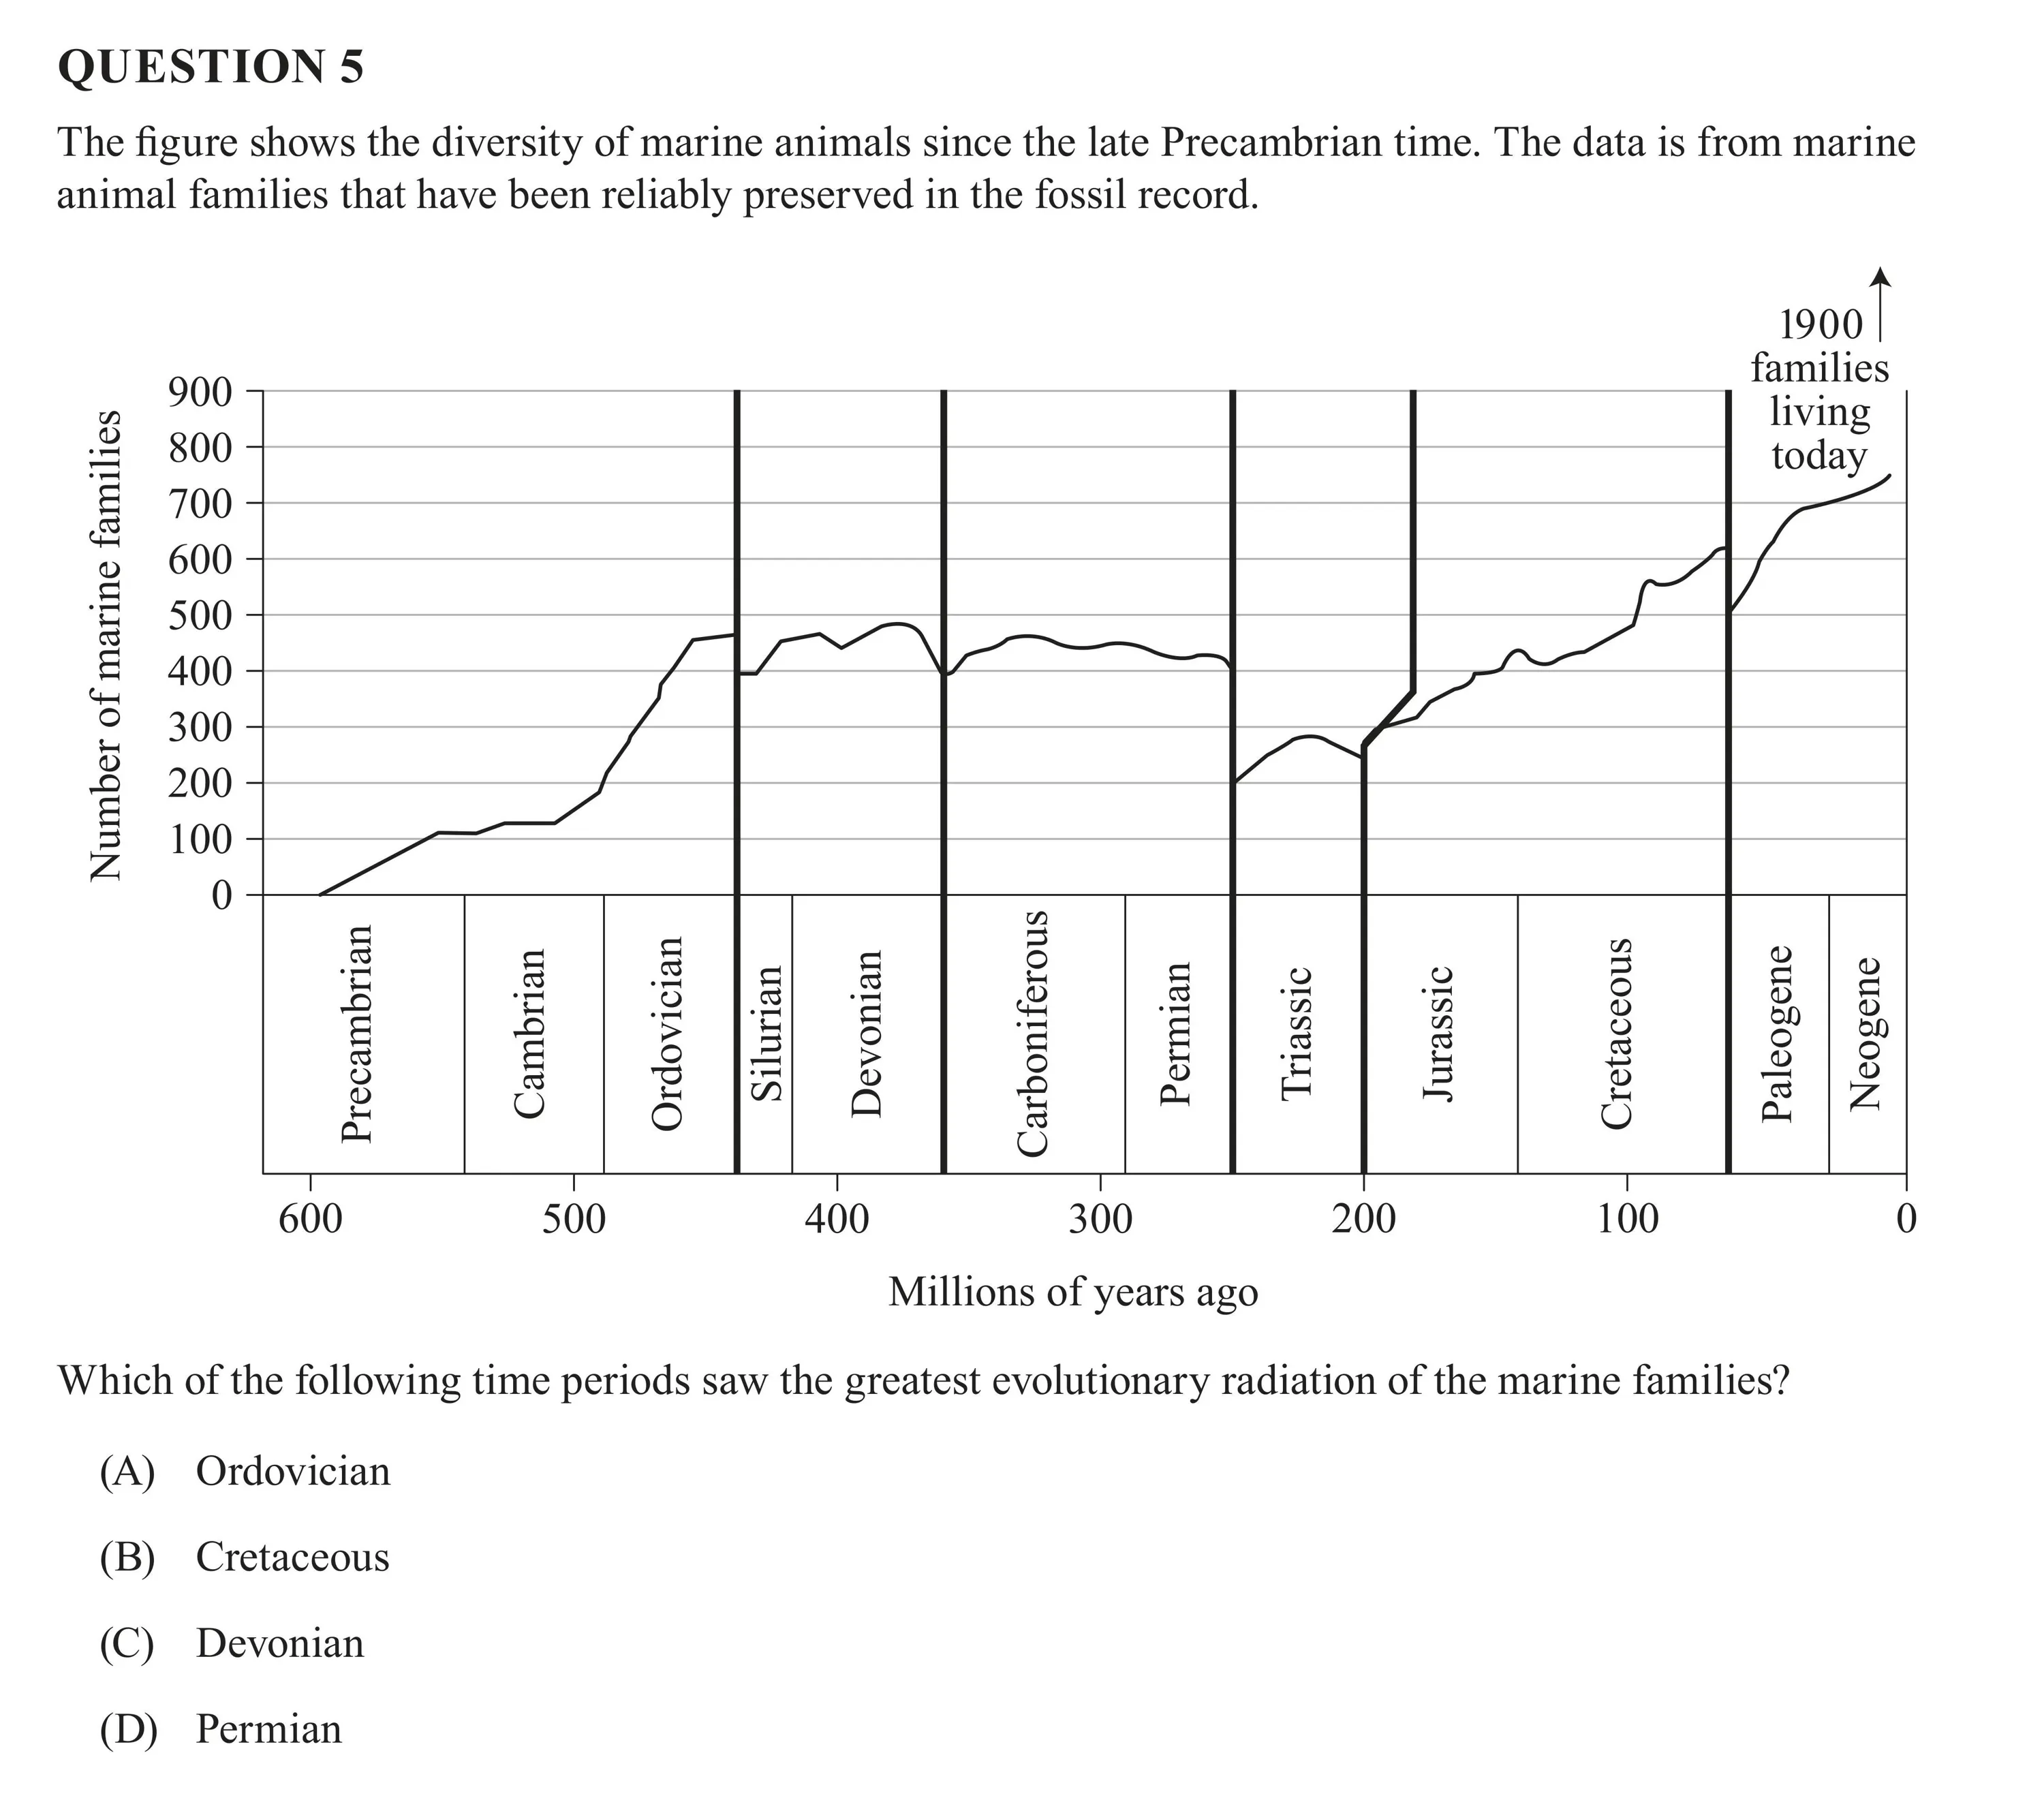
QUESTION 5 The figure shows the diversity of marine animals since the late Precambrian time. The data is from marine animal families that have been reliably preserved in the fossil record. 19OOT families 900 living 800 today 700 600 500 400 300 200 100 Number of marine families o Triassic - Jurassic Cretaceous Paleogene Neogene Ordovician Silurian Devonian Carboniferous Precambrian Cambrian p— S ) S 600 200 W S O N S S Millions of years ago Which of the following time periods saw the greatest evolutionary radiation of the marine families? (A) Ordovician (B) Cretaceous (C) Devonian (D) Permian
![Question-Image]()
![Answer-Image]()
Difficulty: C
-
Paper 1
-
2020

QUESTION 6 The carrying capacity of an ecosystem refers to the (A) total biomass of primary producers in the ecosystem at a given time that supports the higher trophic levels. (B) size of a population that can be supported indefinitely on the available resources and services of that ecosystem. (C) number of individual top predators in the ecosystem at a given time that can be supported by the lower trophic levels. (D) maximum population of individuals of different species that the ecosystem can support for an extended period of time.
![Question-Image]()
![Answer-Image]()

Difficulty: C
-
Paper 1
-
2020

QUESTION 7 When predicting successional change which of the following would typically indicate that an ecosystem is progressing toward its climax community? Abundance of K-selected species | Biomass
![Question-Image]()
![Answer-Image]()

Difficulty: B
-
Paper 1
-
2020

QUESTION 8 The table shows the daily energy input and output for a typical leaf. Incident sunlight Evaporation Heat loss (radiation) Reflection of sunligh Transmission of sunlight Calculate the daily net energy stored by the leaf. (A) 0.8kJ (B) 5.0kJ (C) 36.2kJ (D) 73.5kJ
![Question-Image]()
![Answer-Image]()

Difficulty: C
-
Paper 1
-
2020

QUESTION 9 The table provides population statistics for a species of tree kangaroo in northern Queensland. Determine the population growth rate for tree kangaroos in 2017. (A) 14.6% (B) 15.0% C) 26.5% (D) 86.9%
![Question-Image]()
![Answer-Image]()

Difficulty: B
-
Paper 1
-
2020

QUESTION 10 DNA profiling using polymerase chain reaction (PCR) and gel electrophoresis allows the comparison of (A) genes. (B) entire genomes. (C) DNA fragments. (D) specific sites of mutations.
![Question-Image]()
![Answer-Image]()

Difficulty: C
-
Paper 1
-
2020

QUESTION 11 The Linnaean system originally used which type of evidence for classifying organisms? (A) physical features (B) common ancestry (C) molecular phylogeny (D) reproduction methods
![Question-Image]()
![Answer-Image]()

Difficulty: C
-
Paper 1
-
2020

QUESTION 12 In the structure of DNA adenine pairs with which other base? (A) wuracil (B) guanine (C) cytosine (D) thymine
![Question-Image]()
![Answer-Image]()

Difficulty: C
-
Paper 1
-
2020

QUESTION 13 Which of the following molecules is involved in the transcription of DNA? (A) RNA polymerase (B) DNA helicase (C) transfer RNA (D) amino acids
![Question-Image]()
![Answer-Image]()

Difficulty: C
-
Paper 1
-
2020

QUESTION 14 One of the common assumptions in cladistics is that (A) (B) ©) (D) not all organisms are related by descent. the characteristics of organisms in a population stay the same over time. new kinds of organisms may arise when existing populations divide into two groups. the more shared characteristics two organisms have the more closely related they are.
![Question-Image]()
![Answer-Image]()

Difficulty: C
-
Paper 1
-
2020

QUESTION 15 In watermelon skin colour is controlled by a single autosomal gene. The two phenotypic variants are green and striped. Two plants one homozygous for the green alleles and one homozygous for the striped alleles were crossed. The figure shows the phenotypic frequency for the initial (F ) generation and the subsequent (F ) generation. Frequency 1.0 0.9 0.8 0.7 0.6 0.5 0.4 0.3 0.2 0.1 0.0 Key I:’ green striped Fy F| Generation A cross was then performed between members of the F| generation. What would be the expected frequency of striped watermelon in the next (F ) generation? A) 1.0 (B) 075 (C) 0.50 (D) 0.25
![Question-Image]()
![Answer-Image]()

Difficulty: B
-
Paper 1
-
2020

QUESTION 16 The figures show the original distribution zone of Species I and some possible distribution zones of Species I after the introduction of Species I1. Species II has a competitive advantage over Species I; however it does not tolerate areas of lower rainfall. Before After possible distribution zones ~ D removed from the ecosystem original distribution zone / Rainfall Rainfall Temperature Temperature Which of the following would be an accurate prediction of the new distribution zone for Species 1? (A) Zone A i.e. no change to the distribution (B) Zone B i.e. reduced distribution within the original zone (C) Zone C i.e. new distribution outside the original zone (D) Zone D i.e. complete removal of the species from the ecosystem
![Question-Image]()
![Answer-Image]()

Difficulty: B
-
Paper 1
-
2020

QUESTION 17 The table identifies the condition associated with a variety of ploidy changes. Chromosome number ploidy Monosomy 5 Cri du chat syndrome Trisomy 23 Klinefelter syndrome For a person with XXY sex chromosomes which condition would they have? (A) Cri du chat syndrome (B) Down syndrome (C) Klinefelter syndrome (D) Turner syndrome
![Question-Image]()
![Answer-Image]()

Difficulty: C
-
Paper 1
-
2020

QUESTION 18 The diagram shows the abundance (n) of phenotypic and genotypic variation for the colour trait of a species of butterfly. AA Aa aa n =400 n =500 n= 1000 If these butterflies were placed in an environment with light-coloured trees which option from the table would be the most likely effect on the allelic frequencies? Frequency of allele/genotype A | 2 | AA | I = -- -- --
![Question-Image]()
![Answer-Image]()

Difficulty: C
-
Paper 1
-
2020

QUESTION 19 The table of data shows a comparison of amino acids sequences in the same section of haemoglobin molecules from a number of different species. From the given information which of the following species’s haemoglobin protein is most similar to human haemoglobin protein? Species ’ Sequence of amino acids | Ly | Go | b | B | | Go o oL [ o [ o o
![Question-Image]()
![Answer-Image]()

Difficulty: C
-
Paper 1
-
2020

QUESTION 20 Which of the following are features of both microevolution and macroevolution? (A) mutations only (B) mutations and gene flow only (C) gene flow and genetic drift only (D) mutations gene flow and genetic drift
![Question-Image]()
![Answer-Image]()

Difficulty: C
-
Paper 1
-
2020

QUESTION 21 (2 marks) A count was conducted to determine the number of individuals for five different bird species in a woodland. 55 50 2 45 Cg S 40 '% 35 g 30 S 25 g 20 O g 15 Z 10 5 0 A C D Species Calculate the relative percentage abundance of species B. Show your working.
![Question-Image]()
![Answer-Image]()

Difficulty: B
-
Paper 1
-
2020

QUESTION 22 (4 marks) The following cladogram proposes the evolutionary history of several fish phyla (A—H). A B C D B F G H a) Define the term clade. Circle an example of a clade on the cladogram. [2 marks] b) Which node (1-7) represents the most recent common ancestor for species E and G? [1 mark] c¢) Which two species shared the most recent common ancestor? [1 mark]
![Question-Image]()
![Answer-Image]()

Difficulty: B
-
Paper 1
-
2020

QUESTION 23 (3 marks) Describe differences between r-selected and K-selected species in terms of: * number of offspring parental care and involvement * lifespan. r-selected K-selected Number of offspring Parental care and ivolvement Lifespan
![Question-Image]()
![Answer-Image]()

Difficulty: B
-
Paper 1
-
2020

QUESTION 24 (3 marks) a) Describe what is meant by the genotype of an organism. [1 mark] b) Inherited mutations can affect the genotype of offspring. Describe how this occurs. [2 marks]
![Question-Image]()
![Answer-Image]()

Difficulty: B
-
Paper 1
-
2020

QUESTION 25 (4 marks) The following simplified energy-flow diagram provides the gross productivity figures for producers and herbivores in an ecosystem. plant respiration (including heat) herbivore respiration 16 MJ/m?/year 20 MJ/m?/year Producers i Higher CRESVQESS trophic levels decomposition decomposition 8 MJ/m?/year (waste and death/decay) 5 MJ/m?/year a) Determine the net productivity for the producers and herbivores in this ecosystem. [2 marks] Producers: Netproductivity=___ MJ/m?/year Herbivores: Net productivity=___ MJ/m?/year b) Contrast the outputs of energy for the two trophic levels in the diagram. [2 marks]
![Question-Image]()
![Answer-Image]()

Difficulty: A
-
Paper 1
-
2020

QUESTION 26 (1 mark) Define microevolution.
![Question-Image]()
![Answer-Image]()

Difficulty: C
-
Paper 1
-
2020

QUESTION 27 (4 marks) In a freshwater lake in Africa a species of crab and its snail prey species both exhibit specialisations that are unusual for freshwater species. The crabs possess strong claws with characteristics of marine crabs that crush and peel shells and the snail prey have thick strong shells that resist crushing. a) Identify which pattern of evolution this example represents. [1 mark] b) Describe how the two species may have evolved these characteristics. [3 marks]
![Question-Image]()
![Answer-Image]()

Difficulty: A
-
Paper 1
-
2020

QUESTION 28 (4 marks) Identify two differences between primary and secondary ecological succession. Refer to one example of each type of succession in your response.
![Question-Image]()
![Answer-Image]()

Difficulty: B
-
Paper 1
-
2020

QUESTION 1 (4 marks) a) Explain how a species interaction may be classified as symbiotic. [2 marks] b) Using an example describe the symbiotic relationship of mutualism. [2 marks]
![Question-Image]()
![Answer-Image]()

Difficulty: B
-
Paper 2
-
2020

QUESTION 2 (5 marks) Two species of Paramecium single-celled microorganisms were grown for 4 days in test tubes with a fixed amount of algae added to each tube daily as their food source. The life span for each species ranges from 4—6 hours. Test tubes 1 and 2 each contained a single species and test tube 3 initially contained both species. Live Paramecium population after 4 days (per mL) T w0 T e s w0 a) Identify and describe the ecological principle that relates to these observations. [2 marks] b) Explain the results of the experiment. [3 marks]
![Question-Image]()
![Answer-Image]()

Difficulty: A
-
Paper 2
-
2020

QUESTION 3 (4 marks) Explain the role of the enzymes helicase and DNA polymerase in the process of DNA replication.
![Question-Image]()
![Answer-Image]()

Difficulty: A
-
Paper 2
-
2020

QUESTION 4 (6 marks) An ecologist investigated the species composition of mangrove trees in a natural mangrove forest and an adjacent 30-year-old planted mangrove forest. Three 10 m-wide belt transects were sampled from inland to the sea for each of the forests each covering 100 m on average and placed to cover various strata. The species diversity of Forest A was determined using the Simpson’s Diversity Index (SDI): L B0 WV 7 e | 0|5 ommgoe |5 |0 a) Use the SDI formula to calculate the diversity index for Forest B. Round your answer to two decimal places. [2 marks] b) Identify three reasons why the ecologist used a belt transect rather than line transects or randomly placed quadrats for collecting data to compare these two forests. [3 marks] c) Identify one way in which the ecologist minimised bias in the sampling. [1 mark]
![Question-Image]()
![Answer-Image]()

Difficulty: A
-
Paper 2
-
2020

QUESTION 5 (4 marks) Explain the process of protein synthesis in terms of transcription and translation.
![Question-Image]()
![Answer-Image]()

Difficulty: A
-
Paper 2
-
2020

QUESTION 6 (3 marks) The Bush Stone-curlew is a large mainly nocturnal ground-dwelling bird found on Hamilton Island. Bush Stone-curlews have a wide-ranging diet but prefer to feed on insects molluscs small lizards seeds and occasionally small mammals. During the breeding season nesting birds will search for food in the vicinity of the nest site. a) Identify one factor that would influence carrying capacity on the island. [1 mark] b) Discuss one way the carrying capacity of the Bush Stone-curlew on Hamilton Island could be positively or negatively affected in the future. [2 marks]
![Question-Image]()
![Answer-Image]()

Difficulty: B
-
Paper 2
-
2020

QUESTION 7 (4 marks) Species richness (S) can be determined using the Menhinick’s Index where s is the number of different species represented in a sample and N is the total number of individual organisms in the sample. Species richness (S) = _al JN Sampling of two communities (Community A and Community B) were completed with Community A having S = 0.5 for the six species identified. The results for Community B are shown in the table. Community B e s s [ w Use S to compare Community A with Community B.
![Question-Image]()
![Answer-Image]()

Difficulty: A
-
Paper 2
-
2020

QUESTION 8 (3 marks) In an experiment studying the population dynamics of the house fly two adult house flies were placed in a fly cage with a limited food supply. Population data was collected as summarised in the table. Number of eggs Number of larvae | Number of pupae Number of adults -- Determine the population growth model exhibited by the house fly. Explain your reasoning.
![Question-Image]()
![Answer-Image]()

Difficulty: A
-
Paper 2
-
2020

QUESTION 9 (3 marks) Fossil evidence seems to show that the morphology of the Queensland lung fish has remained relatively unchanged for the past 100 million years. Describe the features of the theory of natural selection to explain how this may have occurred.
![Question-Image]()
![Answer-Image]()

Difficulty: A
-
Paper 2
-
2020

QUESTION 10 (3 marks) Researchers measured the adult beak lengths of an entire population of a species of bird and plotted their results on the graph. After many generations the lengths of the adult beaks were again measured. By comparing this new data to the original data the researchers concluded that the average length of beaks had increased as a result of directional selection. nitial distribution / of beak lengths Frequency 0 5 10 15 20 Beak length (mm) a) Describe directional selection. [2 marks]
![Question-Image]()
![Answer-Image]()

Difficulty: B
-
Paper 2
-
2020

QUESTION 11 (6 marks) The image shows changes in the frequency of a particular gene in a single species of bird leading to a speciation event. These changes have occurred over a period of successive time points (i.e. I IT and III) each separated by approximately 1000 generations. » The letters A B C and D represent separate niches inhabited by the birds. * The arrows depict gene flow between the niches. » The allelic frequency for the gene is shown as f in each niche. 1 111 Draw a conclusion about the type of speciation that has occurred in this population. Explain your reasoning by referring to the information provided in each of the time points.
![Question-Image]()
![Answer-Image]()

Difficulty: A
-
Paper 2
-
2020

QUESTION 1 In mammals inherited mutations can cause variations in the genotype of offspring when they occur in (A) red blood cells. (B) somatic cells. (C) nerve cells. (D) sex cells.
![Question-Image]()
![Answer-Image]()

Difficulty: C
-
Paper 1
-
2021

QUESTION 2 The process of change in the species structure of an ecological community over time is known as (A) cyclic succession. (B) primary succession. (C) ecological succession. (D) secondary succession.
![Question-Image]()
![Answer-Image]()

Difficulty: C
-
Paper 1
-
2021

QUESTION 3 In ocean food webs where phytoplankton is in the first trophic level the second trophic level of zooplankton often has a higher biomass than the phytoplankton at any given time. Which explanation would account for this? (A) (B) © (D) The zooplankton are also able to photosynthesise. Different phytoplankton species are preying on each other. Carnivores in the third trophic level have increased their consumption of zooplankton. The phytoplankton multiply much faster than zooplankton but their lifespan is shorter.
![Question-Image]()
![Answer-Image]()

Difficulty: B
-
Paper 1
-
2021

QUESTION 4 To demonstrate polygenic inheritance of colour in wheat a cross was performed between two intermediate parents (AaBbCc X AaBbCc). Each dominant allele adds a “unit’ of colour to the phenotype. Which graph would depict the number of individuals and number of phenotypes for the cross? A 2 B) =z = 3 2 2 3 3 g g G~ G~ S o 3 z 2 2 Z Z 1 2 3 4 5 6 7 1 2 3 4 5 6 Number of phenotypes for colour Number of phenotypes for colour © = D) = - 5 = 2 3 3 g g = G~ S S 3 3 E g S = Z Z 1 2 3 1 2 Number of phenotypes for colour Number of phenotypes for colour
![Question-Image]()
![Answer-Image]()

Difficulty: B
-
Paper 1
-
2021

QUESTION 5 The graph shows changes for a penguin population and the theoretical carrying capacity of the environment. A Carrying capacity Time Point A on the graph indicates a change in carrying capacity triggered by (A) an increase in penguin pathogens. (B) adecrease in the number of mates available. (C) areduction in space available for nesting sites. (D) an introduced disease affecting the penguins’ survival rates.
![Question-Image]()
![Answer-Image]()

Difficulty: B
-
Paper 1
-
2021

QUESTION 6 The pedigree traces a genetic disease across two generations. Generation [ Key Carrier (not affected) Affected Normal Female O ' Q Generation II Male [l . D The inheritance pattern of this disease can be classified as (A) 1incomplete dominant. (B) autosomal dominant. (C) sex linked. (D) polygenic.
![Question-Image]()
![Answer-Image]()

Difficulty: B
-
Paper 1
-
2021

QUESTION 7 In a long-term study of grasshopper colour in a grassland ecosystem it was found that the most abundant phenotype changed from dark green to straw yellow. dark green straw yellow L7 Population Phenotypic trait (colour) This change in the phenotype is an example of (A) diversifying selection. (B) directional selection. (C) stabilising selection. (D) disruptive selection.
![Question-Image]()
![Answer-Image]()

Difficulty: C
-
Paper 1
-
2021

QUESTION 8 The place where an organism lives is called its (A) niche. (B) habitat. (C) community. (D) environment.
![Question-Image]()
![Answer-Image]()

Difficulty: C
-
Paper 1
-
2021

QUESTION 9 The image represents a gridded quadrat of 20 cm X 20 cm squares used in a plant survey. To calculate cover for a species the surveyor identified each plant species and then counted the number of squares in which the species appeared. Key {% Species A i Species B Not to scale What is the approximate percentage cover of Species A? (A) 22% (B) 44% ©) 53% (D) 58%
![Question-Image]()
![Answer-Image]()

Difficulty: C
-
Paper 1
-
2021

QUESTION 10 The forelimbs of humans dogs birds and whales have a very similar pattern of bones. Human Bird Whale Not to scale The similarity of these structures is best explained by which pattern of evolution? (A) convergent evolution (B) divergent evolution (C) parallel evolution (D) coevolution
![Question-Image]()
![Answer-Image]()

Difficulty: C
-
Paper 1
-
2021

QUESTION 11 In which environment would primary succession occur? (A) fresh lava field (B) harvested wheat crop (C) grassland cleared by fire (D) forest damaged by a cyclone
![Question-Image]()
![Answer-Image]()

Difficulty: C
-
Paper 1
-
2021

QUESTION 12 The phenotypic expression of genes is regulated by (A) transcription factors. (B) random fertilisation. (C) DNA polymerase. (D) helicase.
![Question-Image]()
![Answer-Image]()

Difficulty: C
-
Paper 1
-
2021

QUESTION 13 Which combination of processes demonstrates spermatogenesis? Where process occurs ® four functional haploid gametes one functional gamete with 2-3 polar bodies
![Question-Image]()
![Answer-Image]()

Difficulty: C
-
Paper 1
-
2021

QUESTION 14 Which event could cause a frameshift mutation? (A) non-disjunction during meiosis (B) error during replication (C) Dbase pair substitution (D) heat damage
![Question-Image]()
![Answer-Image]()

Difficulty: B
-
Paper 1
-
2021

QUESTION 15 The table identifies the condition associated with a variety of ploidy changes. Chromosome number (ploidy) Trisomy 23 Klinefelter syndrome For a person who has 45 chromosomes (2n—1) due to an autosomal condition which condition do they have? (A) Cri du chat syndrome (B) Down syndrome (C) Klinefelter syndrome (D) Turner syndrome
![Question-Image]()
![Answer-Image]()

Difficulty: C
-
Paper 1
-
2021

QUESTION 16 A small group of dingoes migrated to a new area and established a population. After several generations the new population showed a different genetic composition from the original population. This is an example of (A) microevolution and gene flow. (B) macroevolution and gene flow. (C) microevolution and genetic drift. (D) macroevolution and genetic drift.
![Question-Image]()
![Answer-Image]()

Difficulty: C
-
Paper 1
-
2021

QUESTION 17 This is a cladogram for seven different classes of organisms (I-VII). Class IT III IV VI VII Which two classes of organisms are most closely related? (A) Tand VII (B) IV and VI (C) TandII (D) IIland IV
![Question-Image]()
![Answer-Image]()

Difficulty: B
-
Paper 1
-
2021

QUESTION 18 Which scenario would create a selection pressure on a given population? (A) change in fur colour (B) change in weather patterns (C) greater resistance to disease (D) 1mproved ability to locate food sources
![Question-Image]()
![Answer-Image]()

Difficulty: C
-
Paper 1
-
2021

QUESTION 19 What is the role of DNA polymerase in DNA replication? (A) breaking the hydrogen bonds that hold the complementary bases of DNA together (B) adding complementary nucleotide bases to the exposed DNA strands (C) sealing the sequence of DNA into two continuous double strands (D) joining RNA primers to the lagging strand of DNA
![Question-Image]()
![Answer-Image]()

Difficulty: C
-
Paper 1
-
2021

QUESTION 20 A keystone species is defined as a species that (A) 1s the top predator in an ecosystem. (B) 1s a major producer in an ecosystem. (C) has a unique and crucial role in an ecosystem. (D) directly influences all species in an ecosystem.
![Question-Image]()
![Answer-Image]()

Difficulty: C
-
Paper 1
-
2021

QUESTION 21 (4 marks) In the Linnaean system of classification the features used to classify living things change according to taxonomic levels. Describe using relevant examples how these features change.
![Question-Image]()
![Answer-Image]()

Difficulty: B
-
Paper 1
-
2021

QUESTION 22 (3 marks) Describe two ways carbon is transformed and one way it is transferred as it cycles through the biotic components of an ecosystem.
![Question-Image]()
![Answer-Image]()

Difficulty: B
-
Paper 1
-
2021

QUESTION 23 (5 marks) To determine the species diversity and species richness of a wetland ecosystem ecologists surveyed communities adjacent to a river using two methods for each community: 1. random species sampling with predetermined grid numbers with 10 quadrats of 4 m? each used for these grids 2. three belt transect lines (50 m X 2 m) across predetermined sampling locations based on strata variation. The map shows the locations of quadrats and transect lines. The table shows survey results. Key m River % Salt marsh Mangroves . Paperbark swamp ‘ Belt transect line [[] Quadrat Not to scale Survey method Belt transect Species richness (number of species) a) Identify three differences between the survey methods used to determine species diversity and species richness in the ecosystem. [3 marks] b) Draw a conclusion about the most suitable method for estimating species diversity and species richness of the communities in this wetland ecosystem. Give a reason to support your conclusion. [2 marks]
![Question-Image]()
![Answer-Image]()

Difficulty: A
-
Paper 1
-
2021

QUESTION 24 (5 marks) The diagram is a hypothetical biomass pyramid for a community. Secondary consumers 76 kg Primary consumers 1520 kg Producers 15200 kg Not to scale a) Contrast the efficiency of the biomass transfers between each level of the pyramid. [3 marks] b) Explain the difference in biomass transfer efficiency identified in Question 24a). [2 marks]
![Question-Image]()
![Answer-Image]()

Difficulty: B
-
Paper 1
-
2021

QUESTION 25 (3 marks) In blood group inheritance in humans three alleles (i I** and I®) determine blood type which can be type O A B or AB. It is known that: o allele I* produces type A and is co-dominant with allele 1B which produces type B « allele 1 produces type O « alleles I* and I® are dominant over allele i. A father who i1s heterozygous type A and a mother who is heterozygous type B have children. Predict the likely frequency of phenotypes for their offspring. Show your working.
![Question-Image]()
![Answer-Image]()

Difficulty: A
-
Paper 1
-
2021

QUESTION 26 (4 marks) a) State the three components of a DNA nucleotide. [1 mark] b) Describe the steps involved in DNA profiling. [3 marks]
![Question-Image]()
![Answer-Image]()

Difficulty: B
-
Paper 1
-
2021

QUESTION 27 (3 marks) The table shows the percentage sequence similarity for three different parts of a gene found in four different eukaryotic species. The data was obtained by comparing DNA from one member of each species to Species A. From this data a proposed phylogenetic tree was produced. 100% 100% 100% e e | e | w o [ [ | D A ™ a Determine whether the phylogenetic tree has been drawn correctly based on the DNA comparison. Explain your reasoning.
![Question-Image]()
![Answer-Image]()

Difficulty: A
-
Paper 1
-
2021

QUESTION 28 (3 marks) The graph depicts the population change of a species after it is introduced into a previously disturbed environment. Phase B Phase A Population size Time Referring to Phase A and Phase B determine the population growth model for the species.
![Question-Image]()
![Answer-Image]()

Difficulty: B
-
Paper 1
-
2021

QUESTION 1 (4 marks) Explain how one abiotic and one biotic factor will affect the population of mosquito larvae in a freshwater pond.
![Question-Image]()
![Answer-Image]()

Difficulty: B
-
Paper 2
-
2021

QUESTION 2 (3 marks) a) Explain the difference between exons and introns. [2 marks] b) State a function of telomeres. [1 mark]
![Question-Image]()
![Answer-Image]()

Difficulty: B
-
Paper 2
-
2021

QUESTION 3 (3 marks) In coastal areas and deserts bare sand dunes may be colonised by plants such as members of the Poaceae family (grasses). Identify three features of these plants that make them effective colonisers.
![Question-Image]()
![Answer-Image]()

Difficulty: C
-
Paper 2
-
2021

QUESTION 4 (2 marks) Explain the purpose of the polymerase chain reaction (PCR) process and provide an example of its application.
![Question-Image]()
![Answer-Image]()

Difficulty: B
-
Paper 2
-
2021

QUESTION 5 (6 marks) Meiosis ensures that a wide range of genetic combinations occurs during the formation of gametes. The diagrams show two processes that occur during meiosis. Process 1 Duplicated homologous chromosomes Process 2 Duplicated chromosomes . Membrane / . Describe the two processes shown in the diagrams and how they contribute to genetic variation in gametes. Name and description of process I: Name and description of process 2:
![Question-Image]()
![Answer-Image]()

Difficulty: A
-
Paper 2
-
2021

QUESTION 6 (2 marks) The term species could be defined as ‘one group of individuals that actually or potentially interbreed 1n nature’. Identify two limitations of this definition.
![Question-Image]()
![Answer-Image]()

Difficulty: B
-
Paper 2
-
2021

QUESTION 7 (3 marks) Koalas were once widespread in Australia. Due to a variety of factors their population decreased and fragmented into small pockets forcing them to inbreed. They have recently been hit by devastating epidemic diseases. Explain why koalas face an increased extinction risk from disease.
![Question-Image]()
![Answer-Image]()

Difficulty: B
-
Paper 2
-
2021

QUESTION 8 (3 marks) Australia has many bird species that have evolved to be largely dependent on mangroves. These species are patchy in their distribution because of: « the island-like distribution of their habitat * exclusion by possible competitors » geographical barriers. Identify and describe the mode of speciation that may have caused diversity in mangrove bird species.
![Question-Image]()
![Answer-Image]()

Difficulty: B
-
Paper 2
-
2021

QUESTION 9 (3 marks) A computer simulation was used to observe genotypic changes in the gene pool of 20 randomly selected rabbits. The simulation was set with these parameters: each rabbit’s coat colour was either black or white » black alleles were dominant; white alleles were recessive « the number of rabbits was constant in each generation and breeding was random throughout the population « an environmental factor was chosen in the simulation to provide selection pressure. The table shows the results of the simulation at the start and after 20 generations. Initial population genotypes Population genotypes after 20 generations BB BB BB BB BB BB BB BB Bb Bb Bb Bb Bb Bb Bb Bb Bb Bb Bb Bb Bb Bb Bb Bb Bb Bb bb bb bb bb bb bb bb bb bb bb bb bb bb bb Contrast the initial allele frequency with the allele frequency after 20 generations to draw a conclusion about the effect of the selection pressure on the rabbit population.
![Question-Image]()
![Answer-Image]()

Difficulty: A
-
Paper 2
-
2021

QUESTION 10 (3 marks) Describe three ways DNA occurs in cells.
![Question-Image]()
![Answer-Image]()

Difficulty: C
-
Paper 2
-
2021

QUESTION 11 (2 marks) Adult skeletal stem cells differentiate into intermediate cells and later into specialised bone tissue types. Skeletal stem cell Intermediate cell Cfi\//ifm@ Compact bone / Cartilage The table shows how three transcription factors (A B and C) affect bone tissue formation. Transcription Intermediate cell Cartilage Compact bone factor role Actlvators Explain the effect of transcription factors on gene expression and tissue formation. Use an example from the table to support your answer.
![Question-Image]()
![Answer-Image]()

Difficulty: A
-
Paper 2
-
2021

QUESTION 12 (5 marks) An investigation compared mangrove species diversity for two areas of different size in the same catchment. The table shows species population counts for each area. Grey mangrove Red mangrove Yellow mangrove 88 (? Total species count a) Calculate Simpson’s diversity index for Area 2. Show your working. SD]_I_[M N(N —1) (correct to two decimal places) b) Using your answer for Question 12a) compare the diversity of the two areas. [2 marks] [3 marks]
![Question-Image]()
![Answer-Image]()

Difficulty: A
-
Paper 2
-
2021

QUESTION 13 (3 marks) The data shows changes in relative abundance of ground cover biomass and species diversity for an abandoned sand mine site over time. Key D Bare ground QGrasses (e.g. spinifex tussock grass) . Seedlings/shrubs (e.g. banksia eucalypt) Leaf litter I:] Mature trees Abundance Key D Biomass — Species diversity Biomass (kg/mz) Time Based on the information provided predict whether further ecological succession would occur in this community. Justify your answer with two relevant reasons.
![Question-Image]()
![Answer-Image]()

Difficulty: A
-
Paper 2
-
2021

QUESTION 1 What is the molecular unit of heredity? (A) gene (B) genome (C) nucleotide (D) chromosome
![Question-Image]()
![Answer-Image]()

Difficulty: C
-
Paper 1
-
2022

QUESTION 2 Which stage of making recombinant DNA requires DNA ligase? (A) cutting (B) joining (C) 1solation (D) transformation
![Question-Image]()
![Answer-Image]()

Difficulty: C
-
Paper 1
-
2022

QUESTION 3 A survey of grasshopper species was conducted across four eucalypt communities. Counts were conducted and the average abundance per 400 m? recorded. Grasshopper species (A-F) ) S N Which community has both the highest species richness and highest evenness for grasshoppers? (A) 1 (B) II (©) I (D) 1V
![Question-Image]()
![Answer-Image]()

Difficulty: C
-
Paper 1
-
2022

QUESTION 4 The graph shows the effect of a selection pressure on a hypothetical population. Phenotype Key [ ] Before the selection pressure B 20 generations later Number of individuals Which mode of phenotypic selection corresponds with the data? (A) negative (B) disruptive (C) stabilising (D) directional
![Question-Image]()
![Answer-Image]()

Difficulty: C
-
Paper 1
-
2022

QUESTION 5 A researcher captured marked and released 36 frogs. The following day they captured 24 frogs and 18 were marked. Calculate the approximate size of the frog population using the Lincoln index: N = Mnj (A) 27 (B) 48 (C) 54 (D) 60
![Question-Image]()
![Answer-Image]()

Difficulty: C
-
Paper 1
-
2022

QUESTION 6 The role of helicase in DNA replication is to (A) 1nitiate the process by binding to recognition sites along the template strand. (B) add complementary bases to the template strand. (C) unwind and separate DNA strands. (D) join DNA strands together.
![Question-Image]()
![Answer-Image]()

Difficulty: C
-
Paper 1
-
2022

QUESTION 7 What 1s used directly by plants for protein synthesis? (A) nitrite NO (B) mnitrate NOy~ (C) ammonia NH; (D) atmospheric nitrogen N
![Question-Image]()
![Answer-Image]()

Difficulty: B
-
Paper 1
-
2022

QUESTION 8 The graph shows how the populations of two species in an ecosystem change over time. Key Species X ---- Species Y 9] 5 . p— c < &0 — o (A 8 l/ \ O / \ O / \ g / \ B / \ Z JER / \ ’ / \ / Y / \ / \ / \ / \ / \\ / / )/ . / 1 277G 7 \ /l —s\\ ’ / \\— N - \\ ’ ~ Time Which species interaction is represented? (A) predation where species X preys on species Y (B) predation where species Y preys on species X (C) competition where species X outcompetes species Y (D) competition where species Y outcompetes species X
![Question-Image]()
![Answer-Image]()

Difficulty: B
-
Paper 1
-
2022

QUESTION 9 Polygenic inheritance involves multiple (A) alleles for a single gene. (B) genes with the same alleles. (C) genes coding for a single characteristic. (D) characteristics resulting from a single gene.
![Question-Image]()
![Answer-Image]()

Difficulty: C
-
Paper 1
-
2022

QUESTION 10 Wings in birds bats and pterosaurs are phenotypically similar though they belong to different families and do not have a common ancestor with the trait. While the general morphology is similar the structure and organisation of each wing is different. This is an example of (A) coevolution. (B) parallel evolution. (C) divergent evolution. (D) convergent evolution.
![Question-Image]()
![Answer-Image]()

Difficulty: C
-
Paper 1
-
2022

QUESTION 11 Evolutionary relationships were investigated by sequencing a section of protein from five different species. Each letter represents an amino acid. Species I D Species 11 D Species I11 D Species IV D Species V D It can be inferred that Species I 1s most closely related to (A) Species II. (B) Species III. (C) Species IV. (D) Species V.
![Question-Image]()
![Answer-Image]()

Difficulty: B
-
Paper 1
-
2022

QUESTION 12 Speciation occurs when (A) the gene pool of an existing species becomes too small to support a viable population. (B) selection pressures cause significant changes to the allele frequencies of a population. (C) genetic drift is no longer occurring within populations. (D) gene flow is no longer occurring between populations.
![Question-Image]()
![Answer-Image]()

Difficulty: C
-
Paper 1
-
2022

QUESTION 13 An error during DNA replication resulted in the following change to mRNA transcripts. mRNA before | AUGAAGUUUGGCAUC ... (continued) mRNA after | AUGAAGUUUGCAUCG ... (continued) The DNA replication error most likely involved (A) (B) ©) (D) deletion of cytosine. insertion of guanine. substitution of uracil with guanine. substitution of guanine with cytosine.
![Question-Image]()
![Answer-Image]()

Difficulty: B
-
Paper 1
-
2022

QUESTION 14 Prior to fertilisation a secondary oocyte will arrest at which stage of meiosis? (A) prophase I (B) prophase II (C) metaphase I (D) metaphase 11
![Question-Image]()
![Answer-Image]()

Difficulty: B
-
Paper 1
-
2022

QUESTION 15 The environment’s influence on gene expression can be investigated by comparing the rate of concordance in monozygotic (identical) and dizygotic (non-identical) twins. Concordance occurs when both twins express a trait. Strong environmental influence is suspected when concordance is (A) higher in monozygotic twins. (B) only observed in dizygotic twins. (C) only observed in monozygotic twins. (D) similar in monozygotic and dizygotic twins.
![Question-Image]()
![Answer-Image]()

Difficulty: C
-
Paper 1
-
2022

QUESTION 16 If each shape represents a different species which diagram shows the common assumptions of cladistics? (A) ] (B) /\ 0 0 ] /\ Time Time (®) A (D) D - h 3 O A\ Time Time
![Question-Image]()
![Answer-Image]()

Difficulty: C
-
Paper 1
-
2022

QUESTION 17 Students used quadrats to investigate biodiversity in a grassland community with scattered distribution of plant species. The students agreed on a counting criteria for each quadrat to (A) reduce the time taken to count the different species. (B) minimise statistical uncertainty. (C) ensure all strata were sampled. (D) minimise bias.
![Question-Image]()
![Answer-Image]()

Difficulty: C
-
Paper 1
-
2022

QUESTION 18 The competitive exclusion principle applies to different species occupying the same (A) niche. (B) habitat. (C) environment. (D) trophic level.
![Question-Image]()
![Answer-Image]()

Difficulty: C
-
Paper 1
-
2022

QUESTION 19 The graph shows the effect of light intensity on the germination success of seeds from four plant species. 100 . .......... Species I 80 g = 60 = < N — - Species II 40 O SN Species 111 201 T e . eec® eec® ...... . ) e . e Species IV Light intensity Which is most likely to be a pioneer species? (A) 1 (B) 1I (C) I (D) 1V
![Question-Image]()
![Answer-Image]()

Difficulty: C
-
Paper 1
-
2022

QUESTION 20 A section of DNA is made up of two strands I and II. Base Strand I Strand II composition | composition owe || e | e wmive | [0 It can be inferred that (A) strand I contains 25% cytosine. (B) strand I contains 32% adenine. (C) strand II contains 29% thymine. (D) strand II contains 71% adenine.
![Question-Image]()
![Answer-Image]()

Difficulty: B
-
Paper 1
-
2022

QUESTION 21 (2 marks) Describe two reproductive strategies used to distinguish K-strategists from r-strategists. Strategy 1: Strategy 2:
![Question-Image]()
![Answer-Image]()

Difficulty: C
-
Paper 1
-
2022

QUESTION 22 (2 marks) Explain how two abiotic factors affect the distribution of species in an ecosystem. Ecosystem: Abiotic factor 1: Abiotic factor 2:
![Question-Image]()
![Answer-Image]()

Difficulty: C
-
Paper 1
-
2022

QUESTION 23 (3 marks) Compare microevolution and macroevolution.
![Question-Image]()
![Answer-Image]()

Difficulty: B
-
Paper 1
-
2022

QUESTION 24 (2 marks) Explain two ways that classifying ecosystems allows for effective management of old-growth forests.
![Question-Image]()
![Answer-Image]()

Difficulty: B
-
Paper 1
-
2022

QUESTION 25 (4 marks) Severe weather events have caused widespread loss of seagrass in meadows off Location A. Seagrasses have the capacity to recover from weather-associated disturbances and return to pre-impact levels within 4 to 60 months. Deep-water meadows have a higher rate of recovery than shallow-water meadows. o Location A Key B Shallow-water meadows [ Deep-water meadows D Sea 0 25 B Land ; L} Lan Kilometres Describe how stratified sampling could be used to study how seagrass meadows off Location A recover after a severe weather event. Identify a surveying technique and purpose for the study in your response.
![Question-Image]()
![Answer-Image]()

Difficulty: A
-
Paper 1
-
2022

QUESTION 26 (4 marks) Karyotypes for two human gametes are shown. Karyotype A (sperm cell) Karyotype B (egg cell) a) Identify which cell exhibits aneuploidy. Refer to evidence from the karyotype. [1 mark] b) Explain how this chromosome abnormality may have occurred. [2 marks] This table lists some genetic conditions resulting from chromosomal abnormalities. Cri du chat syndrome Trisomy 18 Edwards syndrome c) Predict which genetic condition would occur if the two gametes produced a zygote. [1 mark]
![Question-Image]()
![Answer-Image]()

Difficulty: B
-
Paper 1
-
2022

QUESTION 27 (2 marks) Explain the purpose of gel electrophoresis in DNA profiling.
![Question-Image]()
![Answer-Image]()

Difficulty: B
-
Paper 1
-
2022

QUESTION 28 (3 marks) In 1950 the myxoma virus was released into Australian pest rabbit populations to reduce their numbers. The resulting disease myxomatosis initially wiped out 95% of the rabbit population; however it quickly became less effective as a population control measure. This graph shows the frequency of myxomatosis resistance in Australia’s rabbit population from 1949 to 1956. 100 90 S 5 80 o < = 70 5 2 60 & £ 50 o % = 40 (- o > 30 a 3 g 20 [ 10 'v . — | 1949 1950 1951 1952 1953 1954 1955 1956 Year Use evidence from the graph and the principles of natural selection to explain how myxomatosis became ineffective as a population control measure.
![Question-Image]()
![Answer-Image]()

Difficulty: B
-
Paper 1
-
2022

QUESTION 1 (3 marks) This phylogenetic tree uses horizontal distance to represent genetic difference. Species A Species B Species C Species D L 1 unit Scale 1 unit = nucleotide difference a) Infer which species is most closely related to species B. Explain your reasoning. [2 marks] b) Determine the genetic difference between species A and D. [1 mark]
![Question-Image]()
![Answer-Image]()

Difficulty: B
-
Paper 2
-
2022

QUESTION 2 (4 marks) This 1s a biomass pyramid for a grassland community. Not to scale a) Calculate the percentage energy transfer between the first two trophic levels. Show your working. [2 marks] b) Explain the loss of biomass between trophic levels. [2 marks]
![Question-Image]()
![Answer-Image]()

Difficulty: B
-
Paper 2
-
2022

QUESTION 3 (4 marks) A glacier has retreated leaving a large amount of gravel small rocks sand and mud. a) Explain the steps of succession that would occur if the glacier continues to retreat. [3 marks] b) Identify the type of ecological succession. [1 mark]
![Question-Image]()
![Answer-Image]()

Difficulty: B
-
Paper 2
-
2022

QUESTION 4 (1 mark) Define keystone species.
![Question-Image]()
![Answer-Image]()

Difficulty: C
-
Paper 2
-
2022

QUESTION 5 (5 marks) a) Describe the roles of messenger RNA and transfer RNA in protein synthesis. [2 marks] b) Explain how transcription factors control cell differentiation using an example. [3 marks]
![Question-Image]()
![Answer-Image]()

Difficulty: A
-
Paper 2
-
2022

QUESTION 6 (5 marks) An environmental report identified overexploitation habitat destruction and pollution as human activities affecting biodiversity in Australia. The tables show the estimated impact of each activity in 2011 and 2016. 2011 2016 Assessment grade Confidence Assessment grade Very Very H ac‘ggfiis high | High | Low | low high | High | Low impact 1mpact 1 pact 1 pact grade trend impact 1mpact 1 pact 1 pact grade trend Improving Very low impact: Few if any . Adequate: Adequate high- species and/or ecosystems are quality evidence and high level Getting worse suffering substantial adverse effects of consensus from this pressure E Biable Low impact: A small proportion Somewhat adequate: Adequate of species and/or ecosystems are high-quality evidence or high suffering substantial adverse effects level of consensus from this pressure High impact: A significant Limited: Limited evidence or proportion of species and/or limited consensus ecosystems are suffering substantial adverse effects from this pressure Very high impact: A large G Very limited: Limited evidence proportion of species and/or and limited consensus ecosystems are suffering substantial adverse effects from this pressure a) Explain how one human activity identified in the tables could reduce biodiversity. [1 mark] b) Predict which human activities will have the highest and lowest impact on biodiversity in 2023. Explain your reasoning using evidence from the tables. [4 marks] Highest impact: Lowest impact:
![Question-Image]()
![Answer-Image]()

Difficulty: A
-
Paper 2
-
2022

QUESTION 7 (6 marks) The graph shows the population of bacteria in a Petri dish over time. 12000 10000 8000 6000 Population 4000 2000 0 50 100 150 200 250 300 350 Time (minutes) a) Identify the mode of population growth. [1 mark] b) Determine the carrying capacity under these conditions. [1 mark] Conditions were modified at 380 minutes and the population continued to be monitored. Results are shown. 25000 20000 15000 Population 10000 5000 0 100 200 300 400 450 Time (minutes) c) Identify two modifications that could cause this change. Explain your reasoning. [4 marks]
![Question-Image]()
![Answer-Image]()

Difficulty: B
-
Paper 2
-
2022

QUESTION 8 (3 marks) Over time the South African cheetah population has suffered drastic reduction due to periodic droughts disease and hunting. Currently only small isolated populations of cheetahs exist in the wild. Explain in terms of genetic diversity why cheetah populations are now on the verge of extinction.
![Question-Image]()
![Answer-Image]()

Difficulty: B
-
Paper 2
-
2022

QUESTION 9 (3 marks) The biological species concept defines species as a group of organisms that can interbreed to produce fertile offspring. a) Identify another method for defining a species. [1 mark] b) Describe one limitation of the biological species concept and one limitation of the method identified in Question 9a). [2 marks]
![Question-Image]()
![Answer-Image]()

Difficulty: B
-
Paper 2
-
2022

QUESTION 10 (3 marks) In fruit flies eye colour is a sex-linked trait inherited on the X chromosome. The red-eye allele (R) is dominant over the white-eye allele (r). A red-eyed male and white-eyed female have 50 offspring. Use a Punnett square to predict the number of male and female offspring and their eye colour.
![Question-Image]()
![Answer-Image]()

Difficulty: B
-
Paper 2
-
2022

QUESTION 11 (8 marks) Allele frequencies were monitored in two large populations of field mice from neighbouring forests over a 10-year period. Results are shown. Forest X [ e s a) Calculate the allele frequencies for forest Y in 2018. Show your working. [2 marks] b) Identify temporal trends in allele frequency for forests X and Y and infer reasons for the observed differences. [6 marks]
![Question-Image]()
![Answer-Image]()

Difficulty: A
-
Paper 2
-
2022

QUESTION 1 Female Komodo dragons (Varanus komodoensis) in the absence of a mate can produce offspring in which the growth and development of the embryo can occur without the joining of gametes. Identify which of the following methods of reproduction would be used to classify this species. (A) Dbinary fission (B) parthenogenesis (C) internal fertilisation (D) external fertilisation
![Question-Image]()
![Answer-Image]()

Difficulty: C
-
Paper 1
-
Sample

QUESTION 2 An investigation surveyed a land zone that had ¢ high precipitation rates e an open canopy forest with tall emergents and e a well-developed understorey of ferns palms and sclerophyll shrubs. The dominant forest tree species were e flooded gum (Eucalyptus grandis) e Sydney blue gum (Eucalyptus saligna) e red mahogany (Eucalyptus resinifera) and e brush box (Lophostemon confertus). A dominant vegetation community classification system would classify this ecosystem as a (A) rainforest. (B) eucalypt woodland. (C) eucalypt open forest. (D) wet eucalypt open forest.
![Question-Image]()
![Answer-Image]()

Difficulty: C
-
Paper 1
-
Sample

QUESTION 3 In 1978 a population of a migratory shore bird was estimated at 90 000 individuals. An analysis of monitoring data in 2018 showed the population is now at 50 000. The change in population growth for this species is (A) —29% (B) —44% (C) —55% (D) —80%
![Question-Image]()
![Answer-Image]()

Difficulty: C
-
Paper 1
-
Sample

QUESTION 4 This figure shows the relationship between spatial and temporal scale of drivers of ecosystem change. The size of the circles represents the proportion of drivers at a certain spatial scale that had a certain speed. very slow slow medium Temporal scale fast local national global Spatial scale Agricultural intensification along a river has led to substantial increases in fertiliser application and increases in stock numbers. From the given data predict the speed of ecosystem change along this river. (A) fast (B) medium (C) slow (D) very slow
![Question-Image]()
![Answer-Image]()

Difficulty: B
-
Paper 1
-
Sample

QUESTION 5 Identify which of the following is a factor that regulates phenotypic expression of genes during translation. (A) activator (B) repressor (C) promoter (D) microRNA
![Question-Image]()
![Answer-Image]()

Difficulty: B
-
Paper 1
-
Sample

QUESTION 6 Which of the following does not cause macroevolution? (A) time (B) mutation (C) extinction (D) speciation
![Question-Image]()
![Answer-Image]()

Difficulty: C
-
Paper 1
-
Sample

QUESTION 7 The main purpose of gene expression is to (A) transcribe a gene. (B) produce hormones. (C) maintain homeostasis. (D) synthesise a functional gene product.
![Question-Image]()
![Answer-Image]()

Difficulty: C
-
Paper 1
-
Sample

QUESTION 8 Which feature makes pioneer species effective colonisers? (A) large seeds (B) slow-growth rate (C) shade-tolerant seedlings (D) ability to fixate nitrogen
![Question-Image]()
![Answer-Image]()

Difficulty: C
-
Paper 1
-
Sample

QUESTION 9 Which of the following is a biotechnological application of DNA profiling? (A) gene therapy (B) food security (C) drug discovery (D) epigenetic analysis
![Question-Image]()
![Answer-Image]()

Difficulty: C
-
Paper 1
-
Sample

QUESTION 10 This figure is an example of a structure found in DNA. e r—0— Select the option that best represents the figure. (A) histone (B) nucleus (C) chromatin (D) nucleosome
![Question-Image]()
![Answer-Image]()

Difficulty: C
-
Paper 1
-
Sample

QUESTION 11 A group of genes that control the pattern of body formation in humans is being investigated. A gene that would be part of this group is the (A) HOX (homeotic sub-group) gene. (B) TDF (testis-determining factor) gene. (C) SRY (sex-determining region Y) gene. (D) PAX®6 (regulatory gene of eye and brain) gene.
![Question-Image]()
![Answer-Image]()

Difficulty: C
-
Paper 1
-
Sample

QUESTION 12 Which symbiotic interaction occurs when one species is harmed and the other species benefits? (A) parasitism (B) mutualism (C) amensalism (D) commensalism
![Question-Image]()
![Answer-Image]()

Difficulty: C
-
Paper 1
-
Sample

QUESTION 13 During meiosis II what is the role of homologous chromosomes? (A) pairing (B) separation (C) duplication (D) recombination
![Question-Image]()
![Answer-Image]()

Difficulty: C
-
Paper 1
-
Sample

QUESTION 14 This figure shows an energy pyramid for a hypothetical ecosystem. Decomposers Second order consumer = 16 276 kJ/m?/year = 201 kJ/m?/year First order consumer = 2494 kJ/m?/year Primary producers = 36 380 kJ/m?/year The trophic level transfer efficiency of primary producers to herbivores in this situation would be (A) 0.6%. (B) 6.9%. Q) 7.4%. (D) 44.7%.
![Question-Image]()
![Answer-Image]()

Difficulty: C
-
Paper 1
-
Sample

QUESTION 15 The figure below shows a model of two species populations species A and species B competing for the same resource over time. 160 140 Species A — - N o Species B 100 Population density Qo o Time (dimensionless) Identify the response that describes the relationship between the two species over time. (A) species A competitively excludes species B (B) species B competitively excludes species A (C) there is no competitive exclusion coexistence occurs between species (D) either species competitively excludes the other based on population densities
![Question-Image]()
![Answer-Image]()

Difficulty: B
-
Paper 1
-
Sample

QUESTION 16 Haemoglobin gene expression is restricted to erythroid cells. This process is controlled by (A) mutation. (B) translation factors. (C) haemoglobin genes. (D) transcription factors.
![Question-Image]()
![Answer-Image]()

Difficulty: C
-
Paper 1
-
Sample

QUESTION 17 Which of the figures below represents a logistic population growth of a species over time? (A) Population Time (B) Population Time ©) Population Time (D) Population Time
![Question-Image]()
![Answer-Image]()

Difficulty: C
-
Paper 1
-
Sample

QUESTION 18 Evolution during successive generations is a change in the (A) (B) ©) (D) small-scale variation of species’ allele frequencies. genetic transmission of characteristics. genetic composition of a population. divergence of taxonomic groups.
![Question-Image]()
![Answer-Image]()

Difficulty: C
-
Paper 1
-
Sample

QUESTION 19 Polygenic inheritance is defined as (A) one characteristic controlled by one gene. (B) one characteristic controlled by multiple genes. (C) multiple characteristics controlled by one gene. (D) multiple characteristics controlled by multiple genes.
![Question-Image]()
![Answer-Image]()

Difficulty: C
-
Paper 1
-
Sample

QUESTION 20 The graphs below show the trait distribution of a hypothetical population before and after selection. The dotted line indicates the mean of each population. Before selection After selection » 40 ; » 40 3] © . 2 £ s 5 o0 s o0 © ° 2 c c . w 20 w 20 : o o 2 10 2 10 £ g - - < 0 : Z 0 : 0 2 4 6: 8 10 12 14 0 2 4 6 : 8 10 12 14 Phenotype mean Phenotype mean The type of phenotypic selection represented in the graphs is (A) divergent. (B) disruptive. (C) stabilising. (D) directional.
![Question-Image]()
![Answer-Image]()

Difficulty: C
-
Paper 1
-
Sample

QUESTION 21 The figure below represents a section of DNA. LabelIis a (A) nucleotide. (B) covalent bond. (C) hydrogen bond. (D) purine molecule.
![Question-Image]()
![Answer-Image]()

Difficulty: C
-
Paper 1
-
Sample

QUESTION 22 Island populations are often isolated and can face an increased risk of extinction because of (A) 1improved reproductive fitness. (B) reduced genetic diversity. (C) decreased genetic drift. (D) unrestricted gene flow.
![Question-Image]()
![Answer-Image]()

Difficulty: C
-
Paper 1
-
Sample

QUESTION 23 Transfer RNA (tRNA) is a type of molecule that helps decode a messenger RNA sequence into a protein. From this information identify which group tRNA belongs to. (A) exons (B) introns (C) noncoding RNA (D) noncoding DNA
![Question-Image]()
![Answer-Image]()

Difficulty: C
-
Paper 1
-
Sample

QUESTION 24 The figure below shows an evolutionary timeline indicating episodes of evolutionary radiation. Mammals Therapsida Birds Synapsida Sauropsida Archosauria Reptiles Permian Triassic Jurassic Cretaceous Palaeogene Palaeozoic Mesozoic Cenozoic 300 250 200 150 100 50 0 Million years ago (Ma) In which period did the radiation of mammals occur? (A) Triassic (B) Jurassic (C) Cretaceous (D) Palaeogene
![Question-Image]()
![Answer-Image]()

Difficulty: C
-
Paper 1
-
Sample

QUESTION 25 The table below shows the probability of the replacement of one individual tree by another of the same or different species in 50 years’ time. Occupant in 50 years Present occupant Grey birch Red maple Blackgum Beech Red maple 0.00 0.53 0.14 0.31 Blackgum 0.01 0.25 0.57 0.17 Which species is most likely to replace grey birch in a 50-year temporal successional change in this forest? (A) grey birch (B) red maple (C) Dblackgum (D) beech
![Question-Image]()
![Answer-Image]()

Difficulty: C
-
Paper 1
-
Sample

QUESTION 26 (4 marks) Explain microevolutionary change through mutation.
![Question-Image]()
![Answer-Image]()

Difficulty: B
-
Paper 1
-
Sample

QUESTION 27 (4 marks) An experiment compared different strains of bacteria. A wild type (WT) of bacteria and two mutant strains mutant 1 (M1) and mutant (M2) that had different disrupted genes were investigated. Maximal growth rate was used as a determinant of success rate. The results of the experiment are shown below. (a) Competitive ability (b) Growth rate (c) Maximal growth rate 0 ‘“;-_ 0.2 3 0.3 9 2 ~ 0.2 O [ = o 1 © 0.1 O o) — S 0.0 .S_: 0 £ 0.0 c -1 %. —-0.1 0-0.1 = 5 -2 O -0.2 -3-0’—0.2 -3 -0.3 s M1 M2 WT M1 M2 WT M1 M2 WT Strain Strain Strain a) Draw conclusions about the competitive ability and growth rate of the wild type of bacteria used in this experiment. [2 marks] b) Appraise the outcome of the data and determine the success rate of the mutations for this species. [2 marks]
![Question-Image]()
![Answer-Image]()

Difficulty: A
-
Paper 1
-
Sample

QUESTION 28 (5 marks) The figure below shows a model of ecological niche occupation by species A—E. : T :_¢§ Species D - ‘© 2 | ® % © . m = 2 Z 2 3 Cool Warm Niche axis 2 — Temperature a) Identify which two species are occupying the same ecological niche. [1 mark] b) Species A and B have a common ancestor. Which diversification pattern would have occurred between species A and species B for them to occupy these niches? [1 mark] The table below shows the frequencies of genotypes and phenotypes for a particular trait in a generation of species E. Genotype (% frequency) Phenotype (% frequency) TT (0) Tt (100) tt (0) Phenotype 2 (0) c) Predict the next generation’s genotype and phenotype frequency. Which type of inheritance pattern is represented for Phenotype 17 Phenotype 1 (100) [3 marks]
![Question-Image]()
![Answer-Image]()

Difficulty: A
-
Paper 1
-
Sample

QUESTION 29 (6 marks) The diagram below shows fossilised marine organisms found in a site across seven stratum layers. 27 1l (S ’@ ek N b e %\}? 7 a) Analyse the data above to identify three relationships that provide evidence of changes in past ecosystems. Identify at least one biotic change and at least one abiotic change. b) From the given information determine the species richness (D) for strata 2. Use the following formula: S =T Where s= the number of different species represented in the sample and N = the total number of individual organisms in the sample c) Identify one limitation of using fossil evidence to determine species richness.
![Question-Image]()
![Answer-Image]()

Difficulty: A
-
Paper 1
-
Sample

QUESTION 30 (6 marks) The figures below show a forest before harvesting (pre-harvest) and after harvesting (post-harvest). Pre-harvest ' Post-harvest Identify an ecological surveying technique and sampling method that could be used to effectively analyse the change in species diversity between the two ecosystems. Identify a strength and a limitation of each of your choices.
![Question-Image]()
![Answer-Image]()

Difficulty: A
-
Paper 1
-
Sample

QUESTION 1 The biological species concept defines species as a group of organisms (A) with a common set of alleles. (B) descended from a common ancestor. (C) occupying the same niche or adaptive zone. (D) that can interbreed to produce fertile offspring.
![Question-Image]()
![Answer-Image]()

Difficulty: C
-
Paper 1
-
2023

QUESTION 2 Species classified as K-strategists (A) often live in unstable habitats. (B) exhibit an exponential rate of reproduction. (C) reach sexual maturity later than r-strategists. (D) are first to colonise a new environment created by a disturbance.
![Question-Image]()
![Answer-Image]()

Difficulty: C
-
Paper 1
-
2023

QUESTION 3 The table provides population data for a species of fairy-wren. Year Population on Births Deaths Immigration | Emigration 1st January 2022 15200 200 7600 | 4310 | The population growth rate in 2022 was closest to (A) 17% (B) 27% (C) 55% (D) 73%
![Question-Image]()
![Answer-Image]()

Difficulty: B
-
Paper 1
-
2023

QUESTION 4 Populations with reduced genetic diversity face an increased risk of extinction because they (A) have fewer chromosomes. (B) have difficulty finding mates for reproduction. (C) are less likely to adapt to changing environments. (D) contain a larger proportion of heterozygous individuals.
![Question-Image]()
![Answer-Image]()

Difficulty: C
-
Paper 1
-
2023

QUESTION 7 The distributions of phenotypes before and after a selection pressure acted on a population are shown. Which graph shows disruptive selection? === Before selection pressure 25 generations later (A) (B) Number of individuals Number of individuals (C) (D) Number of individuals Number of individuals Phenotype
![Question-Image]()
![Answer-Image]()

Difficulty: C
-
Paper 1
-
2023

QUESTION 8 The diagram shows a human karyotype and a list of genetic conditions. HON OE oH G GOR cS OFEOdE OBS OGHE 3k oes Which genetic condition is indicated in the karyotype? (A) Turner syndrome (B) Cri du chat syndrome (C) Edwards syndrome (D) Down syndrome
![Question-Image]()
![Answer-Image]()

Difficulty: C
-
Paper 1
-
2023

QUESTION 9 An ecological niche refers to (A) a group of organisms competing for the same resources. (B) the role and space that an organism fills in an ecosystem. (C) all organisms occupying a physical space close enough to interact with each other. (D) the largest population of a particular species that can be supported by an ecosystem.
![Question-Image]()
![Answer-Image]()

Difficulty: C
-
Paper 1
-
2023

QUESTION 10 The graph shows extinction rates over time. a ee NO) PPD PS 107 Extinction rate (families per million years a a re 500 450 400 350 300 250 200 ©1506 6100 8§©650 0 Millions of years ago (Mya) How many times in the past 500 million years has the extinction rate exceeded 14 families per million years? (A) 3 (B) 4 (C) 5 (D) 6
![Question-Image]()
![Answer-Image]()

Difficulty: C
-
Paper 1
-
2023

QUESTION 11 Restriction enzymes (A) (B) (C) (D) join DNA into a single strand. cut DNA at specific locations. add nucleotides to a growing DNA strand. assist in the amplification of recombinant DNA.
![Question-Image]()
![Answer-Image]()

Difficulty: C
-
Paper 1
-
2023

QUESTION 12 The graph shows the results of a study on the species richness of gut microbes. The data represents the cumulative number of species observed as the number of samples increased. 800 700 600 500 400 300 Number of species 200 100 8 10 12 14 16 Number of samples Based on this data the minimum number of samples required to obtain valid species richness data is (A) 2 (B) 6 (C) 12 (D) 16
![Question-Image]()
![Answer-Image]()

Difficulty: B
-
Paper 1
-
2023

QUESTION 14 An energy pyramid for an aquatic ecosystem is shown (values are in kJ m secondary consumers 410 primary consumers 3400 producers 21 600 Transfer efficiency between producers and primary consumers is closest to —2 y’). Not to scale (A) 5% (B) 10% (C) 12% (D) 16%
![Question-Image]()
![Answer-Image]()

Difficulty: B
-
Paper 1
-
2023

QUESTION 15 Allele frequencies are most likely to stay constant in (A) large populations with low levels of migration. (B) small populations with low levels of migration. (C) large populations with high levels of migration. (D) small populations with high levels of migration.
![Question-Image]()
![Answer-Image]()

Difficulty: C
-
Paper 1
-
2023

QUESTION 16 The diagram shows a section of DNA. DNA SO Key [_] Introns [3 Exons Immediately following transcription and RNA splicing the product would most closely resemble (A) mRNA: SSS (B) tRNA: _ [RSs (C) mRNA:CL_ TT [ ] (D) tRNA: [[ J J
![Question-Image]()
![Answer-Image]()

Difficulty: C
-
Paper 1
-
2023

QUESTION 17 What is the most likely outcome of a homeobox (HOX) gene mutation? (A) slower growth rate (B) body appendages in the incorrect location (C) failure of sex characteristics to fully develop (D) impaired ability of red blood cells to carry oxygen
![Question-Image]()
![Answer-Image]()

Difficulty: C
-
Paper 1
-
2023

QUESTION 18 Calcium chloride (CaCl ) is a chemical used in bacterial transformation. An experiment was conducted to determine how the concentration of calcium chloride affects the transformation efficiency of large and small plasmids. Error bars show standard error. | Key — Small plasmids .———- Large plasmids Transformation efficiency (104 cfu/1g) 0.0 0.1 0.2 0.3 0.4 0.5 0.6 CaCl concentration (M) The data suggests that (A) the optimal concentration for transforming small plasmids is 0.15 M. (B) transformation efficiency is highest at concentrations greater than 0.1 M. (C) large plasmids have higher transformation efficiency than small plasmids. (D) there is less variation in transformation efficiency of small plasmids when concentration is less than 0.2 M.
![Question-Image]()
![Answer-Image]()

Difficulty: B
-
Paper 1
-
2023

QUESTION 19 Electrophoresis separates DNA fragments based on (A) size with larger fragments travelling further through the gel. (B) size with smaller fragments travelling further through the gel. (C) charge with more positively charged fragments travelling further through the gel. (D) charge with more negatively charged fragments travelling further through the gel.
![Question-Image]()
![Answer-Image]()

Difficulty: C
-
Paper 1
-
2023

QUESTION 20 The capture—recapture method and Lincoln index (N = ant) were used to monitor a population of m platypuses over a four-year period. Experimental findings are shown. 26 24 22 20 18 16 14 Number of platypuses 2019 2020 2021 2022 Year The table shows data from one year of the study. Number of individuals captured and marked in first sampling Number of individuals captured in second sampling Number of recaptured individuals marked When was the data in the table collected? (A) 2019 (B) 2020 (C) 2021 (D) 2022
![Question-Image]()
![Answer-Image]()

Difficulty: C
-
Paper 1
-
2023

QUESTION 22 (2 marks) Describe two ways bacteria assist matter to cycle through ecosystems.
![Question-Image]()
![Answer-Image]()

Difficulty: B
-
Paper 1
-
2023

QUESTION 23 (3 marks) Mistletoe is the common name for plants that have a close and long-term interaction with a host tree. In Australia mistletoe frequently live on eucalyptus trees penetrating the bark with their modified root systems to access water and nutrients from the xylem. This can restrict nutrient flow in the host tree and may cause parts of its branches to die. a) Identify the species interaction demonstrated in this scenario. [1 mark] b) Explain how this relationship differs from predation. [2 marks]
![Question-Image]()
![Answer-Image]()

Difficulty: B
-
Paper 1
-
2023

QUESTION 24 (5 marks) The frequency of a new allele was monitored in a population of insects over an 18-year period. Frequency 0.0 2004 2006 2008 2010 2012 2014 2016 2018 2020 2022 Year a) Infer if the new allele is advantageous or detrimental in this environment. Justify your response using evidence from the graph. [2 marks] b) Explain how mutations can contribute to microevolutionary change in populations [3 marks] that reproduce sexually.
![Question-Image]()
![Answer-Image]()

Difficulty: B
-
Paper 1
-
2023

QUESTION 25 (6 marks) The effect of an invasive species on plant biodiversity was investigated by collecting this data from an ecosystem. Percentage cover (invasive species) 0-20% >20-40% | >40-60% | >60-80% | >80-100% Species richness Simpson’s diversity index a) Contrast species richness in areas of low invasive species cover (0O—20%) with areas of high invasive species cover (>80—100%). [1 mark] biodiversity b) Draw aconclusion about the effect of the invasive species on plant biodiversity in this ecosystem. Justify your response. [2 marks] c) Explain why having data on species richness and Simpson’s diversity index is more informative than a single measure for the purpose of this investigation. Refer to the table to support your response. [3 marks]
![Question-Image]()
![Answer-Image]()

Difficulty: B
-
Paper 1
-
2023

QUESTION 26 (3 marks) Wedge-tailed eagles are large birds that reside in tall trees where they build nests for their young. They often feed on ground-dwelling herbivores such as kangaroos and rabbits. The graph shows the number of wedge-tailed eagles observed in an ecosystem over time. 800 700 | Sf | | 600 LAY ! [ 300 200 / : 3 : 100 : 0 2010 2012 2014 2016 2018 2020 2022 Number of eagles Year a) Determine the carrying capacity of wedge-tailed eagles in this ecosystem. [1 mark] b) Explain how a change to one abiotic factor could reduce the carrying capacity. [2 marks]
![Question-Image]()
![Answer-Image]()

Difficulty: B
-
Paper 1
-
2023

QUESTION 27 (3 marks) Clownfish have 24 pairs of chromosomes and reproduce via external fertilisation with gametes initially created through meiosis. Females lay up to 1500 eggs and then males swim over the eggs and fertilise them. Explain how the processes of independent assortment and random fertilisation create variation in the genotypes of clownfish offspring.
![Question-Image]()
![Answer-Image]()

Difficulty: A
-
Paper 1
-
2023

QUESTION 2 (4 marks) The diagram shows feeding relationships for an Australian ecosystem. a) Use the data to explain why dingoes are a Keystone species. [2 marks] b) Predict the effect a drastic reduction in the number of dingoes would have on the termite population. Justify your response. [2 marks]


QUESTION 3 (7 marks) The chart shows the inheritance pattern of a trait which is thought to be sex-linked dominant. Key C] Male with the trait Parents @ Female with the trait Offspring |_] Male without the trait 1-16 used to identify each individual ©) Female without the trait a) Identify how many offspring of individuals 1 and 2 have the trait. [1 mark] b) Identify evidence to support the conclusion that the trait is sex-linked dominant. Justify your response using a Punnett square. [4 marks] c) Infer the genotype of individual 6. Explain your reasoning. [2 marks]
![Question-Image]()
![Answer-Image]()

Difficulty: B
-
Paper 2
-
2023

QUESTION 4 (5 marks) The hummingbird hawkmoth (phylum: Arthropoda) is named for its similarity to hummingbirds (phylum: Chordata). The two species have independently developed similar feeding structures which they use to draw nectar from tube-shaped flowers. Both species help plants reproduce by distributing their pollen. a) b) c) Hummingbird hawkmoth Hummingbird Identify the diversification pattern demonstrated by the hummingbird and the hummingbird hawkmoth. [1 mark] Use the principles of natural selection to explain the similarities between the two species. [2 marks] Explain how coevolution of the hummingbird hawkmoth and tube-shaped flowers may have occurred. [2 marks]
![Question-Image]()
![Answer-Image]()

Difficulty: B
-
Paper 2
-
2023

QUESTION 7 (5 marks) The diagram shows the stages of succession in an ecosystem. Stage 1 Stage 2 Stage 3 Bare rock Lichen and Trees and shrubs herbaceous plants Time Stage 4 Mature forest a) Identify the type of ecological succession depicted. Explain your reasoning. b) Infer two features of the species in stage 2 and describe the role of these species in ecological succession. [2 marks] [3 marks]
![Question-Image]()
![Answer-Image]()

Difficulty: B
-
Paper 2
-
2023

QUESTION 8 (3 marks) Explain how temporal isolation can lead to speciation.
![Question-Image]()
![Answer-Image]()

Difficulty: B
-
Paper 2
-
2023

QUESTION 9 (7 marks) The graphs show the findings of an experiment investigating the competitive exclusion principle. Two species of protozoa (P. aurelia and P. caudatum) were grown separately and together under identical conditions. Grown separately Grown together 300 250 300 250 P. aurelia lia N S o N S Oo one sens seni e deen esce cesses sees ous sere serenrenbennnaeesnewesuaed 150 100 100 50--—/ 2s = -- P caudatum Population density (cells/mL) a S Population density (cells/mL) 50 Fe i a o+ P. caudatum 0 5 10 15 20 10 20 Time (days) Time (days) a) Identify the population density of P caudatum on day 10 when grown separately. [1 mark] b) Compare the growth of P. aurelia in the two graphs. [3 marks] c) Use the data to explain the competitive exclusion principle. [3 marks]
![Question-Image]()
![Answer-Image]()

Difficulty: A
-
Paper 2
-
2023

QUESTION 5 (3 marks) Nucleic acid sequences were used to investigate evolutionary relationships between four species. Species Nucleic acid sequence GACCGCATTTACGTA GACGTCATATCCGTA a) b) GACCGCATTTCCGTA GACGGCATATCCGTA Explain how data from conserved molecular sequences can be used to estimate time since divergence. Use the data to infer species I-IV in the cladogram. Species Species Species Species I: B. bartonus II: [2 marks] [1 mark] Il:
![Question-Image]()
![Answer-Image]()

Difficulty: B
-
Paper 2
-
2023

QUESTION 6 (3 marks) Explain how twin studies can be used to investigate the effect of the environment on gene expression.
![Question-Image]()
![Answer-Image]()

Difficulty: B
-
Paper 2
-
2023

QUESTION 1 (6 marks) The profile diagram shows a representative section of an ecosystem. Height (m) Distance (m) This table can be used to classify ecosystems based on Specht’s classification system. Foliage cover of tallest plant layer Dense (70—100%) Mid-dense (30—70%) | Sparse (10-30%) Tall closed-forest Tall open-forest Tall woodland Closed-forest Woodland Low closed-forest Low woodland Closed-scrub Tall shrubland Classify this ecosystem. [1 mark] Describe how field data could be collected for the purpose of classifying this ecosystem using Specht’s classification system. Include at least one strategy to minimise bias. [3 marks] Explain how Specht’s classification system could be used to monitor how the ecosystem recovers after a logging event that removes 80% of trees from the tallest plant layer. [2 marks]
![Question-Image]()
![Answer-Image]()

Difficulty: B
-
Paper 2
-
2023

QUESTION 5 Which statement is true for DNA replication? (A) (B) (C) (D) Adenine pairs with guanine. The process occurs during metaphase I. DNA polymerase unwinds the double helix. New strands are synthesised in the 5’ to 3’ direction.
![Question-Image]()
![Answer-Image]()

Difficulty: C
-
Paper 1
-
2023
